Fig. 1.

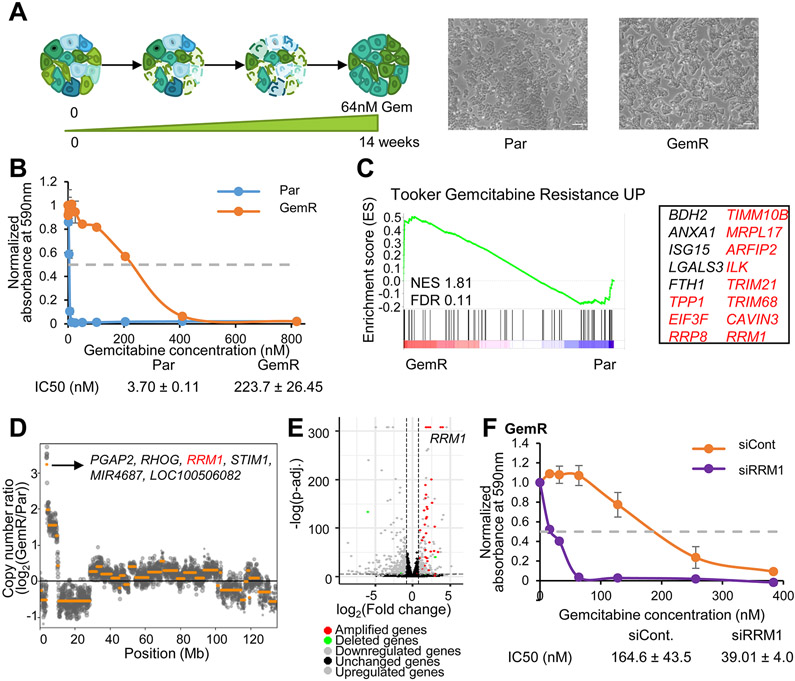
Amplification of a portion of chromosome 11 elicits gemcitabine resistance. (A) Scheme depicting the establishment of GemR. Images of Par and GemR. Scale=1.36mm. (B) Proliferation assay of Par and GemR treated with gemcitabine for 7 days. The absorbance of cell titer blue was normalized to the respective vehicle absorbance. Mean ±SD, n=2. IC50 values ±SD, n=2. (C) GSEA showing an enrichment of the gemcitabine resistance signature in GemR. Significantly enriched genes are listed and classified into amplified genes on chr11 (in red). (D) Copy number variation analysis of GemR compared to Par in chr11 and highest amplified genes. (E) Volcano plot of differentially regulated, amplified and deleted genes in GemR compared to Par. (F) GemR proliferation assay upon RRM1 knockdown and treatment with gemcitabine for 7 days. The absorbance of solubilized crystal violet was normalized to the respective vehicle absorbance. Mean ±SD, n=2. IC50 values ±SD, n=2.
