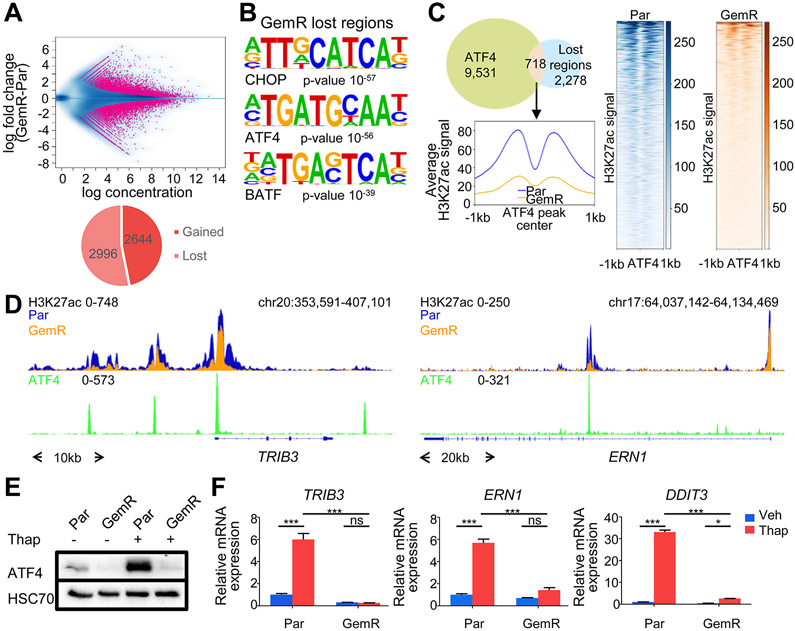
Fig. 2.

ATF4 activity and ER stress response are dampened in GemR. (A) MA plot and pie chart of differentially occupied H3K27ac regions in GemR and Par. (B) Top most significantly enriched motifs in H3K27ac lost regions in GemR. (C) Venn diagram of ATF4 peaks in Par after thapsigargin (Thap) treatment and H3K27ac lost regions in GemR. Aggregate plot and heatmaps of H3K27ac on ATF4 summits of overlapping regions. (D) ATF4 and H3K27ac profiles around the TSS of stress responsive genes. (E) Western blot of ATF4 in Par and GemR treated with thapsigargin (Thap). (F) Expression of stress responsive genes upon thapsigargin (Thap) treatment in Par and GemR. Mean ±SD, n=3. *P≤0.05, **P≤0.01, ***P≤0.001, ns=not significant.
