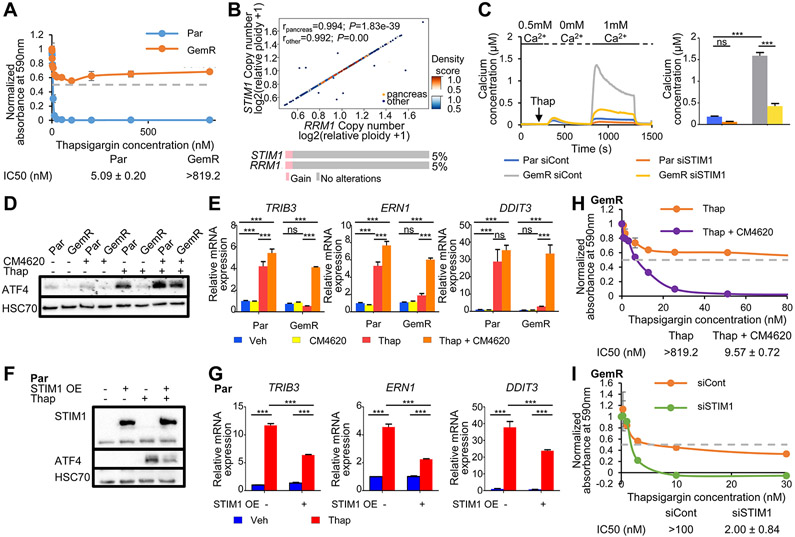
Fig. 3.

Amplification of STIM1 leads to increased SOCE and ER stress resistance in GemR. (A) Proliferation assay of Par and GemR treated with thapsigargin for 7 days. The absorbance of cell titer blue was normalized to the respective vehicle absorbance. Mean ±SD, n=2. IC50 values ±SD, n=2. (B) Density scatter plot showing the Spearman correlation of the copy number of RRM1 and STIM1 in pancreatic and other cancer cell lines obtained from DepMap. rpancreas=0.994, P=1.83e-39; rother=0.992, P=0.00. Oncoprint and percentage of pancreatic cancer patients displaying a gain of STIM1 and RRM1 from TCGA PanCancer Atlas Studies data (cBioportal). (C) Fura-2 based cytosolic calcium imaging and quantification of ΔSOCEmax. Mean ±SEM, n=334 (Par siCont), 143 (Par siSTIM1), 347 (GemR siCont), 243 (GemR siSTIM1). (D) Western blot showing ATF4 levels upon SOCE inhibition by CM4620 and thapsigargin (Thap) treatment in Par and GemR. (E) Expression of stress responsive genes upon SOCE inhibition by CM4620 and thapsigargin (Thap) treatment in Par and GemR. Mean ±SD, n=3. (F) Western blot of STIM1 and ATF4 levels upon STIM1 overexpression and thapsigargin (Thap) treatment in Par. (G) Expression of stress responsive genes upon STIM1 overexpression and thapsigargin (Thap) treatment in Par. Mean ±SD, n=3. (H) Proliferation assay of GemR treated with thapsigargin and the SOCE inhibitor CM4620 for 7 days. The absorbance of cell titer blue was normalized to the respective vehicle absorbance. Mean ±SD, n=2. IC50 values ±SD, n=2. The profile of GemR treated with thapsigargin (Thap) only was previously shown in Fig. 3A. (I) Proliferation assay of GemR upon STIM1 knockdown and thapsigargin treatment (Thap). The absorbance of solubilized crystal violet was normalized to the respective vehicle absorbance. Mean ±SD, n=2. IC50 values ±SD, n=2. *P≤0.05, **P≤0.01, ***P≤0.001, ns=not significant.
