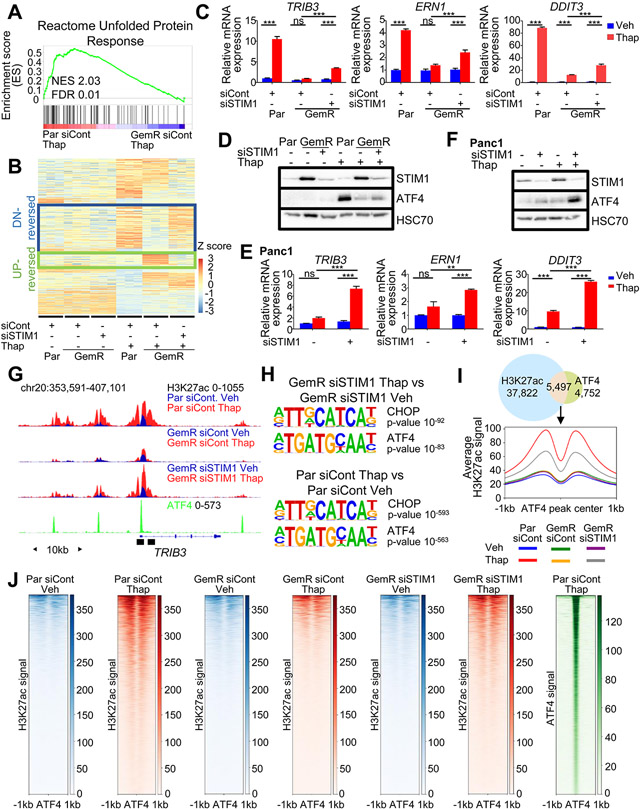
Fig. 4.

STIM1 depletion sensitizes GemR to ER stress and partially rescues H3K27ac around ATF4-occupied regions. (A) GSEA showing an enrichment for the unfolded protein response upon thapsigargin (Thap) treatment in Par compared to GemR. (B) Heatmap showing the Z-score of each gene ordered into 4 clusters identified by hierarchical clustering highlighting gene clusters: DN-reversed and UP-reversed. (C) Expression of DN-reversed genes upon thapsigargin (Thap) treatment in Par, GemR and STIM1-depleted GemR. Mean ±SD, n=3. (D) Western Blot of ATF4 and STIM1 levels upon a STIM1 knockdown and thapsigargin (Thap) treatment in Par and GemR. (E) Expression of DN-reversed genes upon thapsigargin (Thap) treatment in Panc1 and STIM1-depleted Panc1. Mean ±SD, n=3. (F) Western Blot of ATF4 and STIM1 levels upon a STIM1 knockdown and thapsigargin (Thap) treatment in Panc1. (G) ATF4 profile in Par treated with thapsigargin (Thap) and H3K27ac profile in Par and GemR upon thapsigargin (Thap) treatment and STIM1 depletion. Black boxes indicate the regions used for ChIP qPCR. (H) Top most significantly enriched motifs on gained H3K27ac regions in thapsigargin-treated (Thap) STIM1-depleted GemR compared to vehicle-treated STIM1-depleted GemR (top) and on gained H3K27ac regions in Par treated with thapsigargin (Thap) compared to vehicle-treated Par (bottom). (I) Venn diagram of ATF4 peaks in Par treated with thapsigargin (Thap) and gained H3K27ac regions in Par treated with thapsigargin (Thap) compared to vehicle-treated Par. Aggregate plot of H3K27ac on ATF4 summits of overlapping regions. (J) Heatmaps of H3K27ac and ATF4 on ATF4 summits of overlapping regions from Fig. 4I. *P≤0.05, **P≤0.01, ***P≤0.001, ns=not significant.
