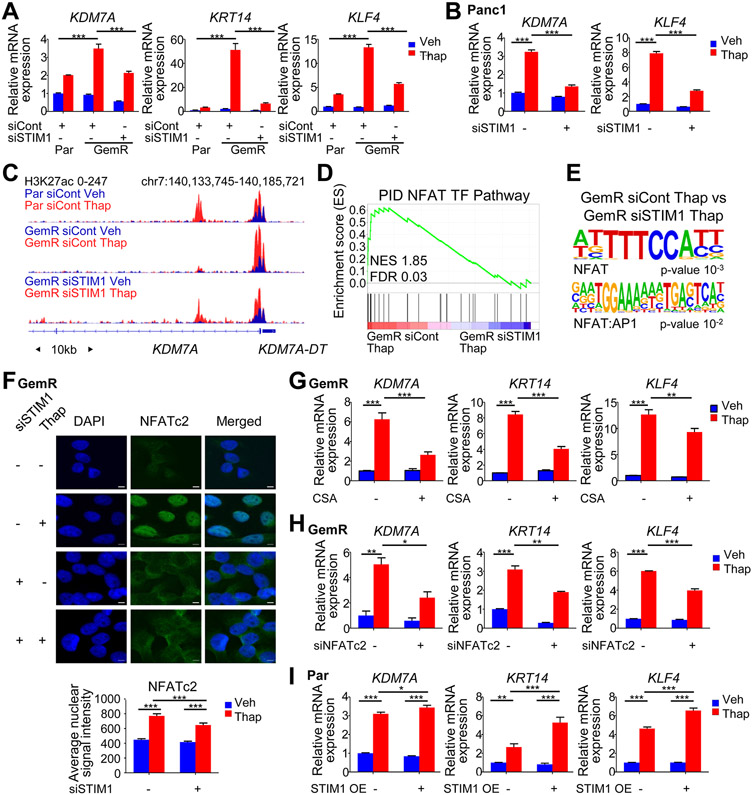
Fig. 5.

STIM1 amplified cells aberrantly activate NFAT. (A) Gene expression of UP-reversed genes upon thapsigargin (Thap) treatment and STIM1 depletion in Par and GemR. Mean ±SD, n=3. (B) Gene expression of UP-reversed genes upon thapsigargin (Thap) treatment and STIM1 depletion in Panc1. Mean ±SD, n=3. (C) H3K27ac profile around the TSS of KDM7A in Par, GemR and STIM1-depleted GemR treated with thapsigargin (Thap). (D) GSEA showing an enrichment for the NFAT TF pathway in GemR compared to STIM1-depleted GemR both treated with thapsigargin (Thap). (E) Motif analysis showing a significant enrichment for NFAT motifs on gained H3K27ac regions in GemR compared to STIM1-depleted GemR both treated with thapsigargin (Thap). (F) NFATc2 immunofluorescence and average nuclear signal intensity in GemR. Scale=5μm. Mean ±SEM, n=68 (GemR siCont Veh), 57 (GemR siCont Thap), 30 (GemR siSTIM1 Veh), 82 (GemR siSTIM1 Thap). (G) Expression of UP-reversed genes upon cyclosporine A (CSA) and thapsigargin (Thap) treatments in GemR. Mean ±SD, n=3. (H) Expression of UP-reversed genes upon NFATc2 knockdown and thapsigargin (Thap) treatment in GemR. Mean ±SD, n=2. (I) Expression of UP-reversed genes upon STIM1 overexpression and thapsigargin (Thap) treatment in Par. Mean ±SD, n=3. *P≤0.05, **P≤0.01, ***P≤0.001, ns=not significant.
