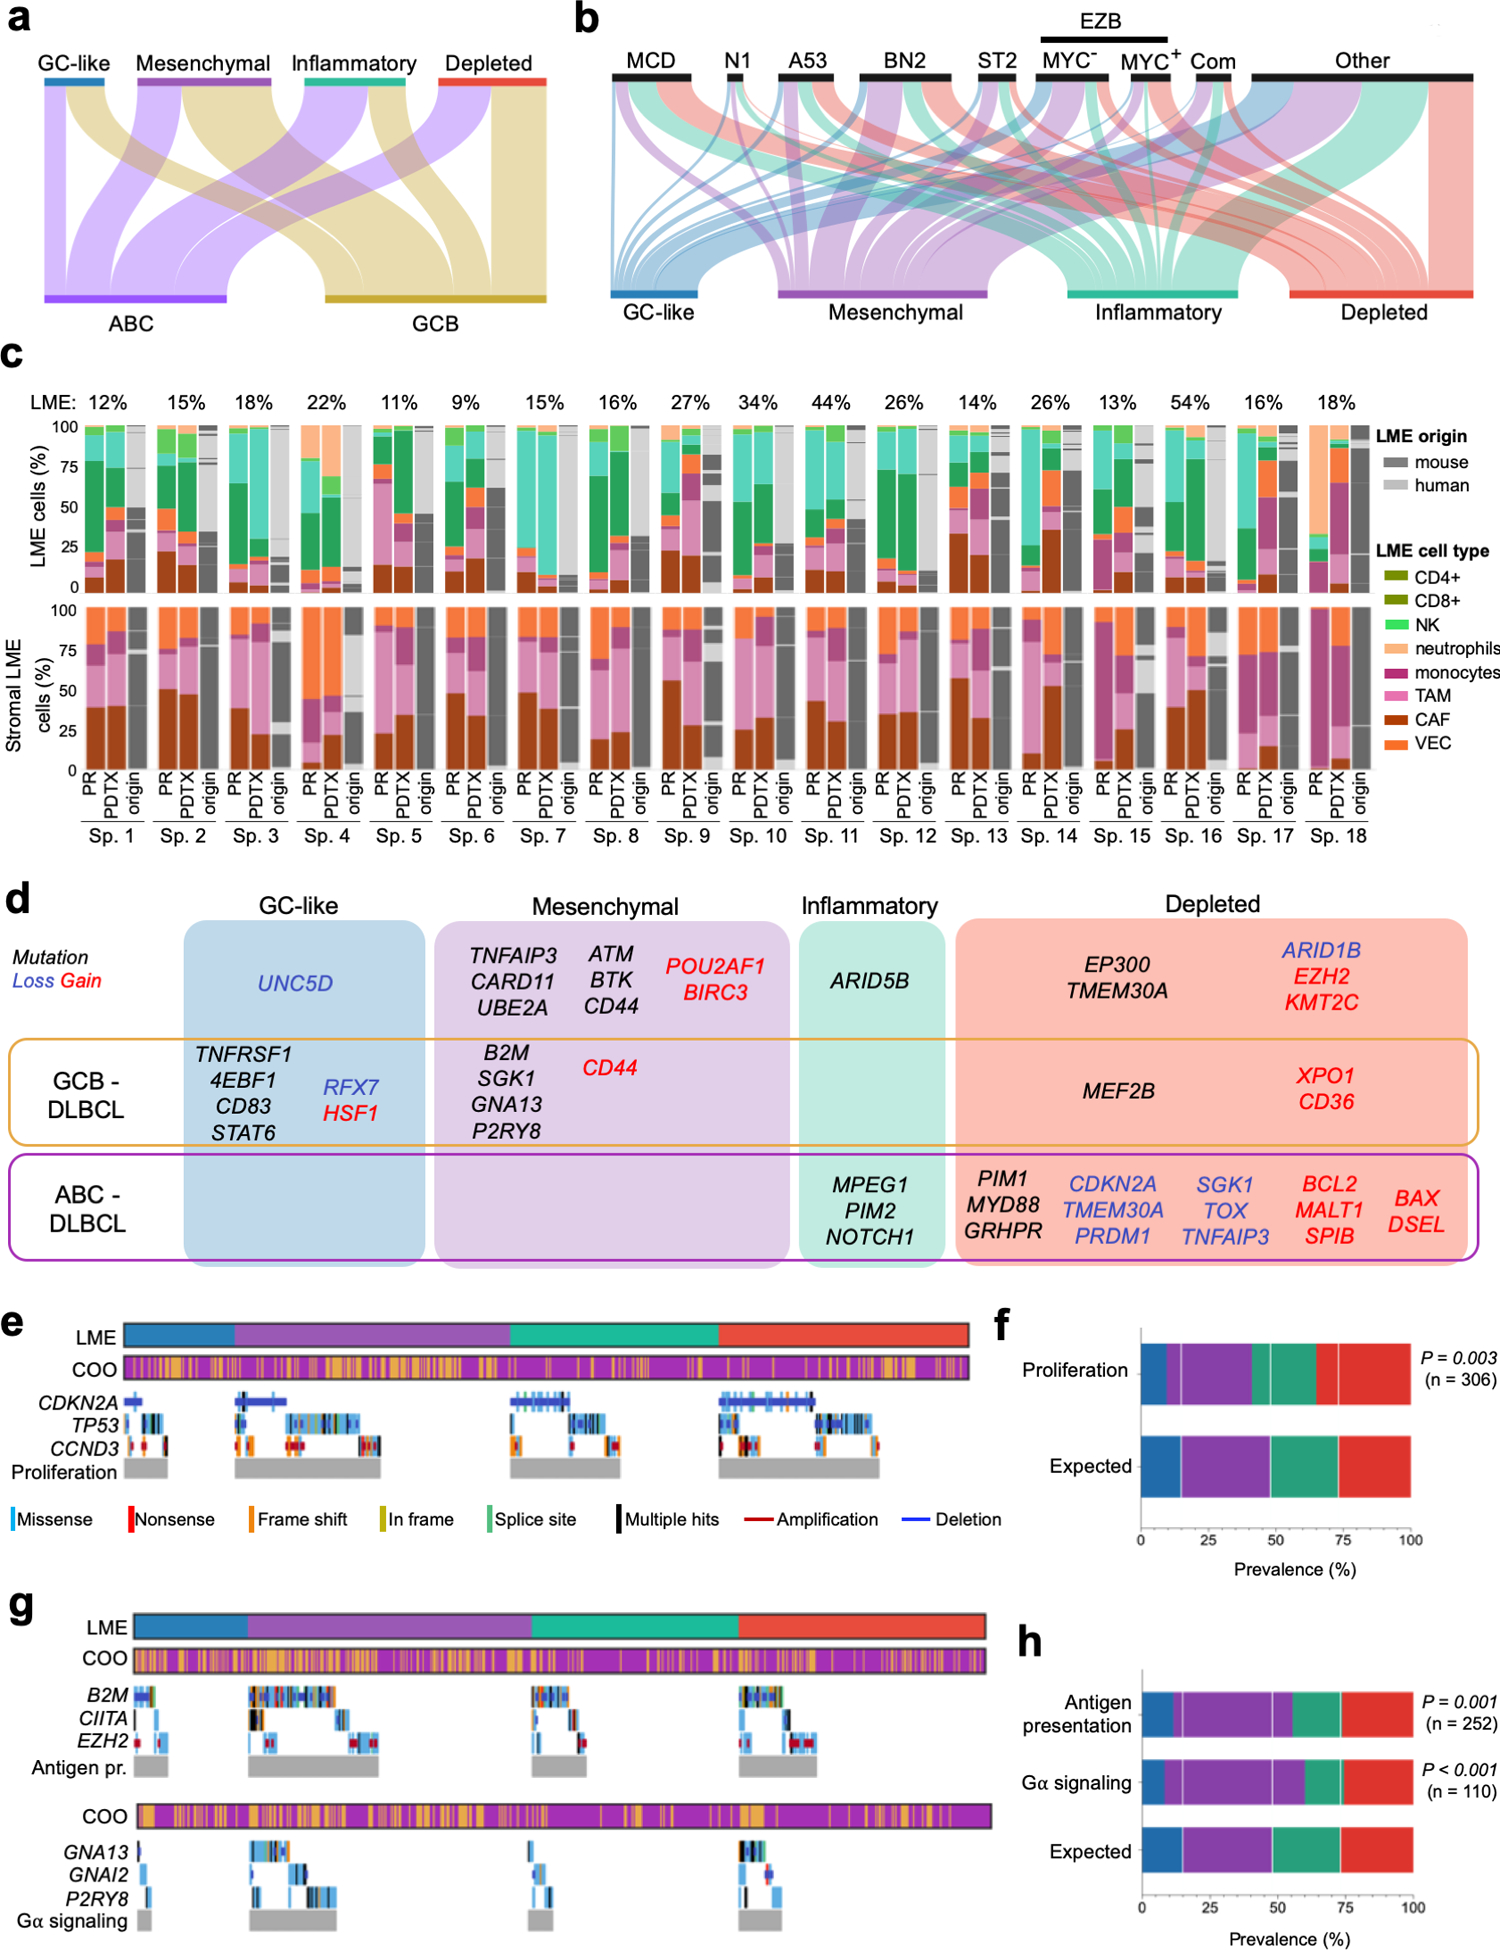
Figure 2. Association of LME categories with genomic alterations in DLBCL cells.

a. Distribution of the DLBCL cell-based COO transcriptomic signature subgroups within the LME categories. b. Distribution of DLBCL genomic subtypes MCD, N1, A53, BN2, ST2, EZB, composite and others within LME categories. c. LME cellular composition (first column for primary samples and second columns for their patient-derived tumor xenograft) and LME origin (mouse vs. human, third column). Upper columns represent percentage of total LME cells and lower columns the percentage of stromal LME cells. The proportion of LME vs. lymphoma cells in primary samples is shown on top of the columns. d. Mutations and copy number alterations significantly enriched (Fisher T-test) in a particular LME category. Alterations also significantly enriched in a COO subgroup are indicated. e. Oncoplot for genomic alterations affecting the proliferation pathway genes CDKN2A, TP53 and CCND3 by LME category. f. Prevalence of proliferation pathway genomic alterations by LME category according to their expected random distribution. The number of cases with these genomic alterations is shown. g. Oncoplot for genomic alterations affecting antigen presentation genes B2M, CIITA and EZH2, and G-protein signaling pathway genes GNAI2, GNA13 and P2RY8 by LME categories. h. Prevalence of antigen presentation and G-protein signaling pathways genomic alterations by LME category according to their expected random distribution. The number of cases with these genomic alterations in each category is shown.
