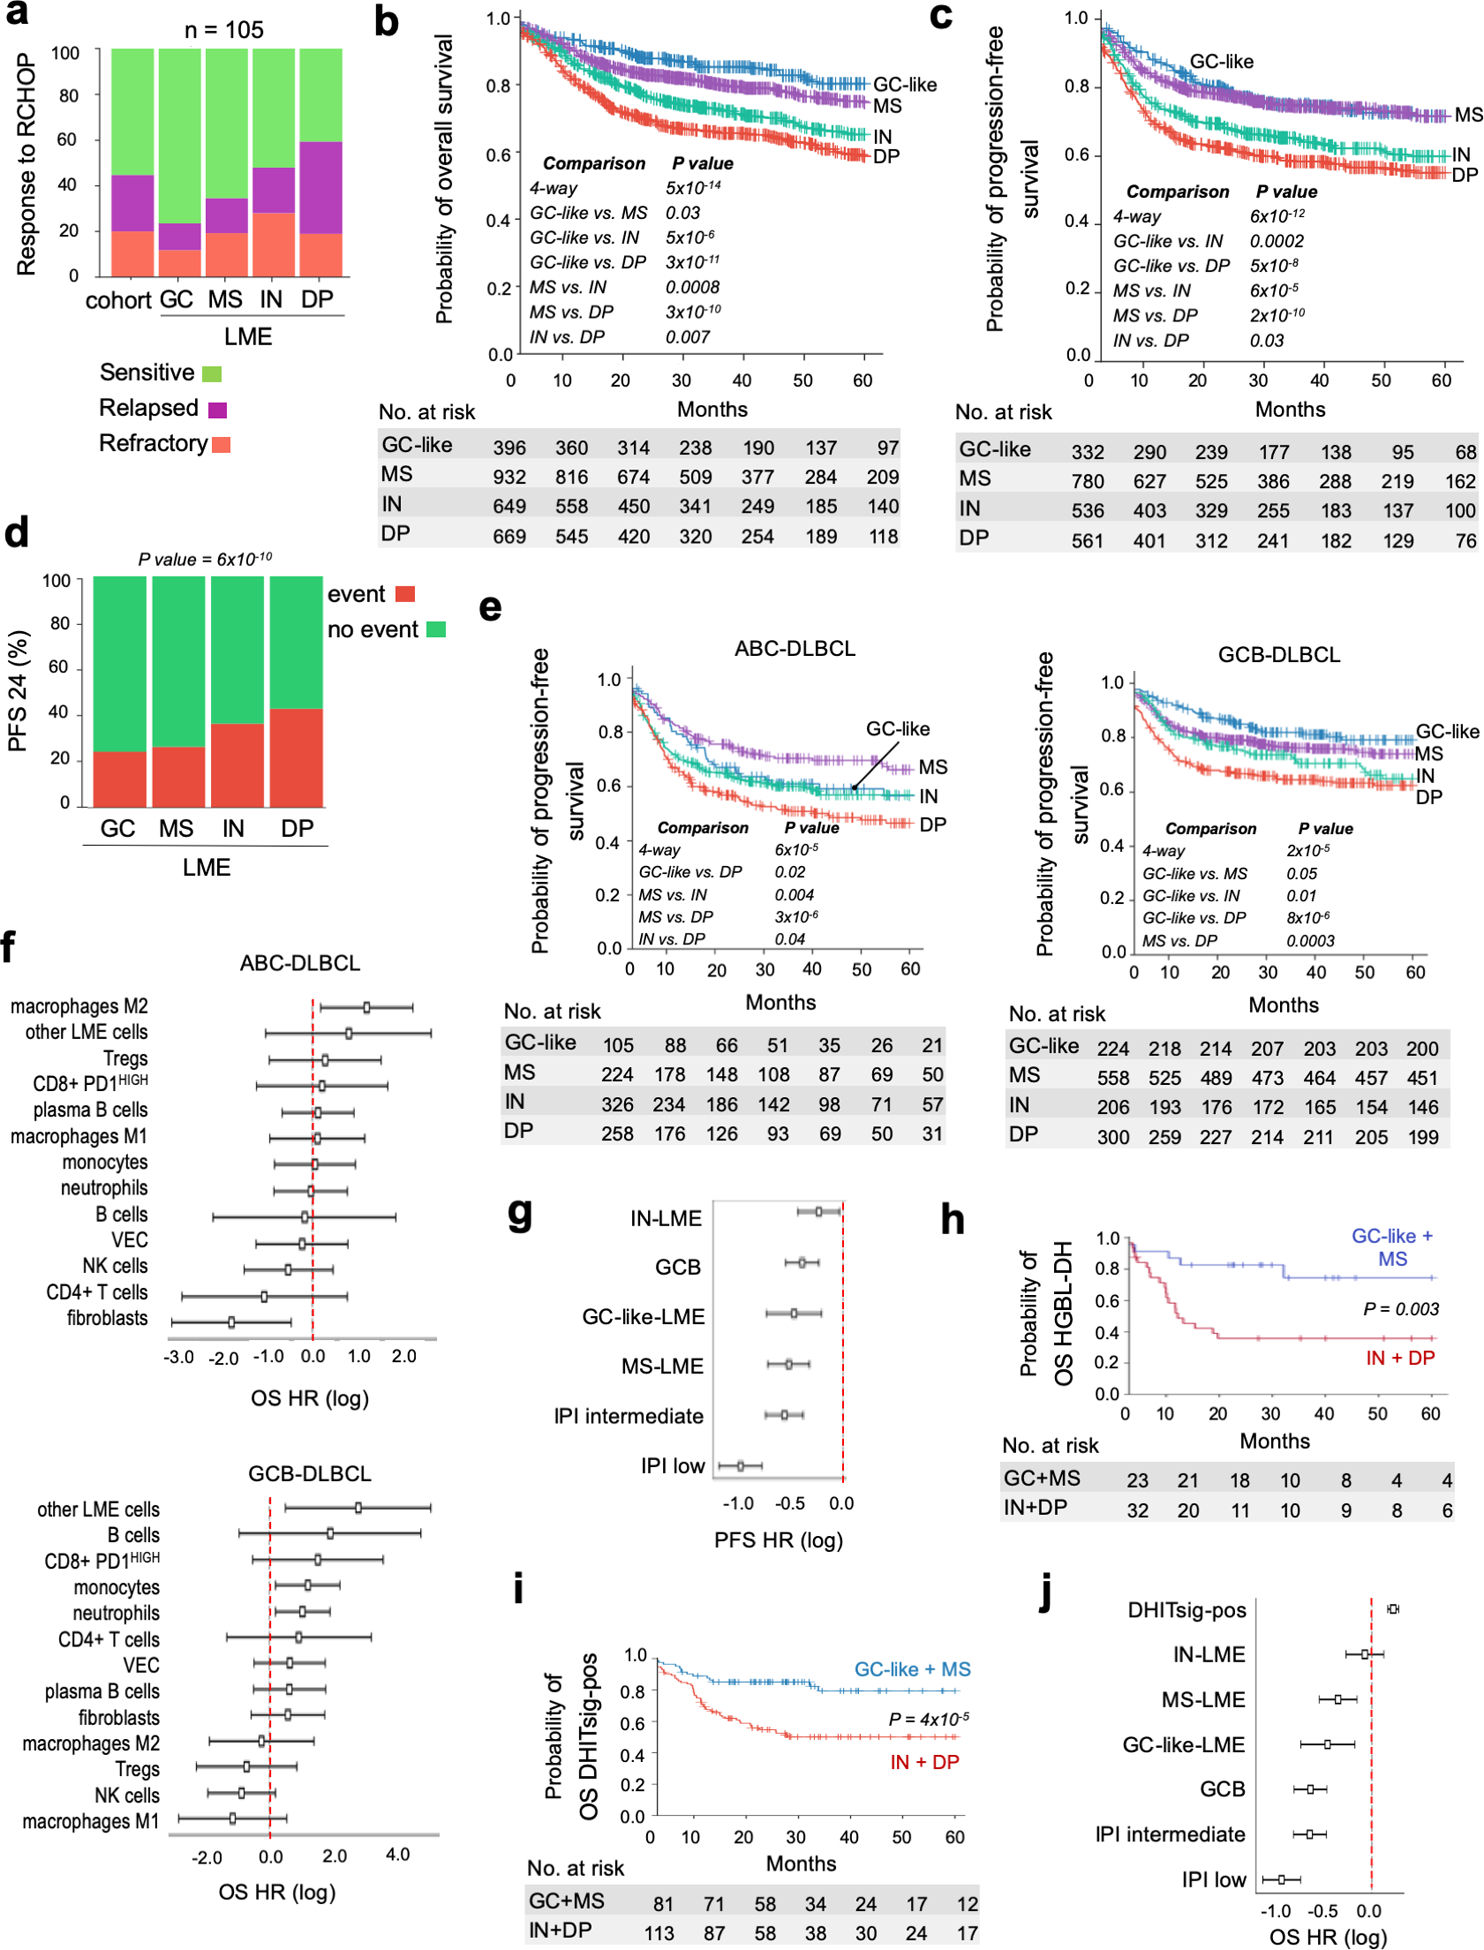
Figure 3. Association of DLBCL LME categories with clinical outcome.

a. Response to chemoimmunotherapy (R-CHOP) in a balanced cohort (n = 105) or responsive and non-responsive (refractory and relapsed) DLBCL patients according to the LME category. b-c. Kaplan-Meier models of overall survival (OS) and progression-free survival (PFS), respectively, according to DLBCL LME category. d. PFS at 24 months (PFS24) in DLBCL patients according to the LME category. Censored patients are not shown. e. Kaplan-Meier models of PFS according to LME category in ABC- and GCB-DLBCL subgroups. Only statistically significant pairwise comparisons are shown. f. Contribution individual LME cellular subtypes to the OS hazard ratio (HR) (log with 95% confidence interval) in ABC- (top) and GCB-DLBCLs (bottom). g. PFS hazard ratio (HR) plots (log with 95% confidence interval) for LME category, COO subgroup and IPI. h. Kaplan-Meier models of OS for HGBL-DH patients segregated into favorable prognosis LMEs (GC-like and MS) and unfavorable prognosis LMEs (IN and DP). i. Kaplan-Meier models of OS for DHITsig-positive patients segregated into favorable prognosis LMEs (GC-like and MS) and unfavorable prognosis LMEs (IN and DP). j. OS hazard ratio (HR) plots (log with 95% confidence interval, n = 2,047) for LME category, COO subgroup, IPI and DHITsig status.
