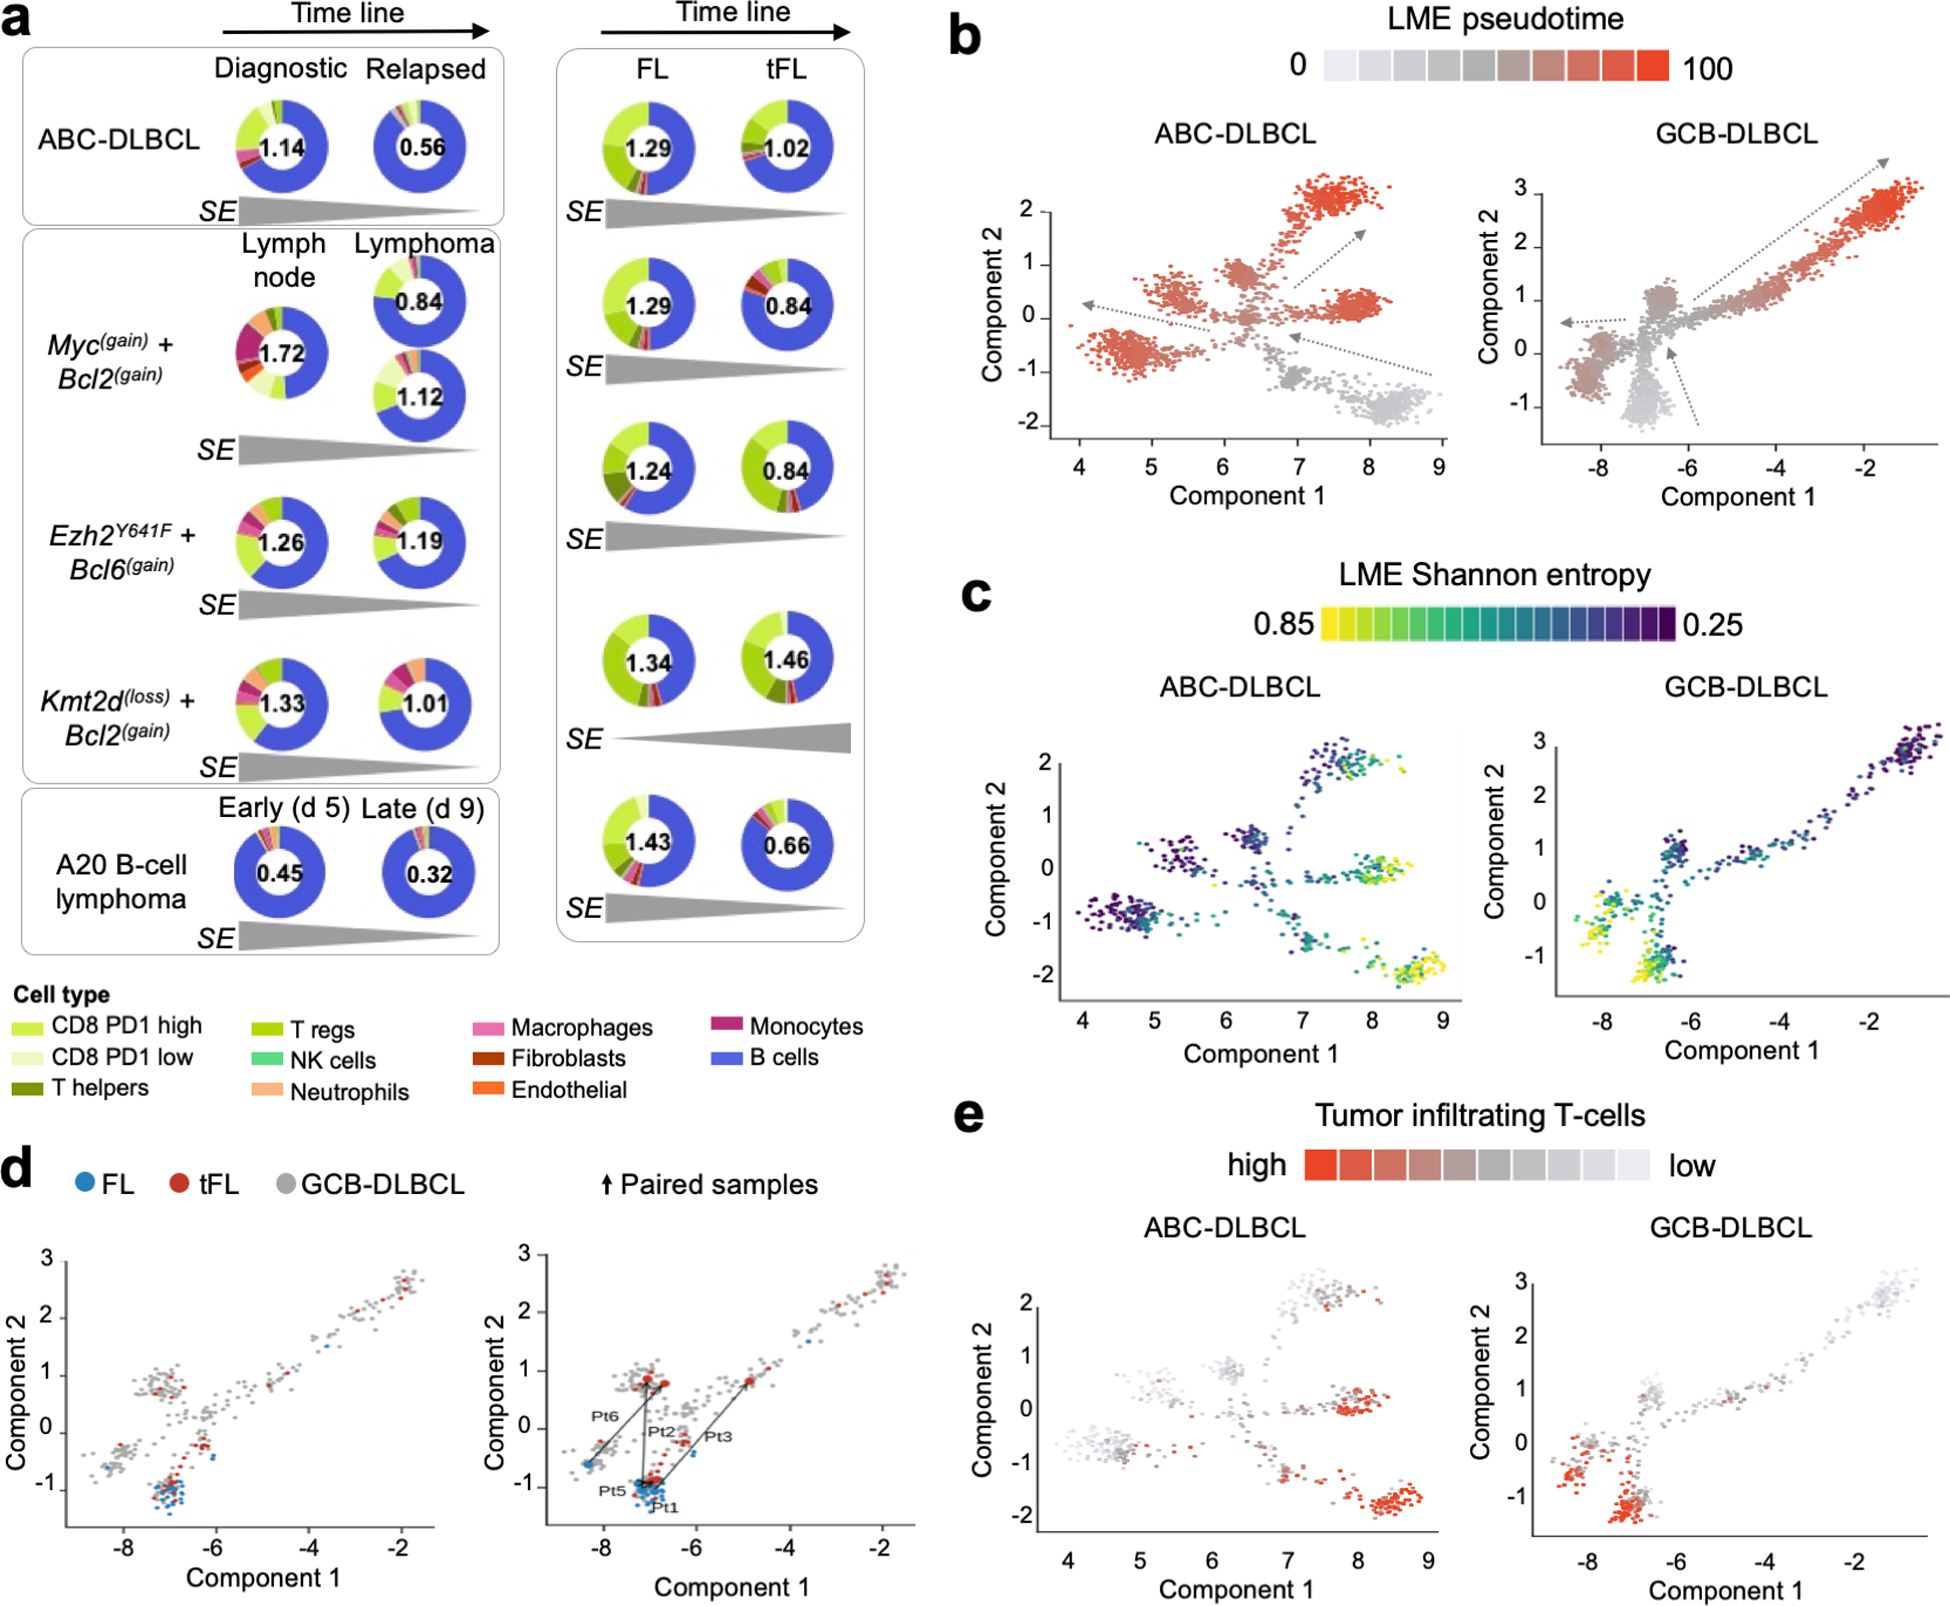
Figure 6. Changes in LME cellular composition during lymphoma progression.

a. LME cellular heterogeneity measured as Shannon entropy (SE) as function of lymphoma progression. Early and late time points include: matched ABC-DLBCL primary and relapsed case, three GEMMs comparing pre-malignant lymph node niches and lymphoma niches, A20 syngeneic B-cell lymphoma model at days 5 and 9 after implantation and five paired indolent FL phase and at the moment of transformation. The SE metric is shown inside every donut plot and the tendency over time is shown at the bottom for each pair. The proportion of cell populations including B-cells are represented in the donut plot. b. Pseudotime analysis of LME progression in ABC and GCB-DLBCLs. c. LME Shannon entropy analysis imposed on the LME pseudotime analysis. d. LME of FL, tFL and de novo GCB-DLBCLs imposed on the LME pseudotime of GCB-DLBCLs (left). Paired FL-tFL samples (n = 5) shown on the LME pseudotime of GCB-DLBCLs (right). e. Analysis of proportion of tumor infiltrating T cells imposed on the pseudotime analysis of BC and GCB-DLBCLs. Density of T cells is shown as color scale.
