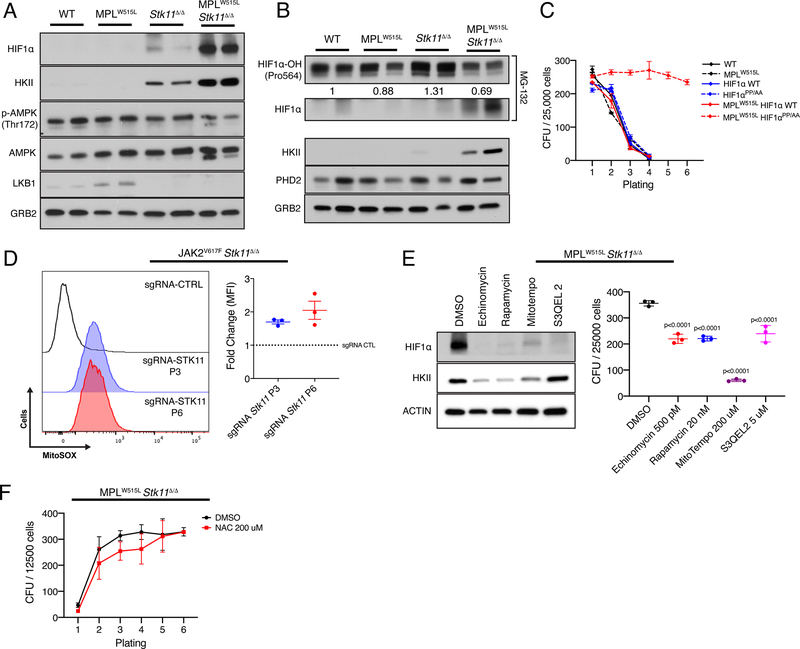
Figure 2: Stabilization of HIF1a promotes colony formation in cells with MPLW515L that are deficient for Stk11.
A) Western blot analysis of protein levels in hematopoietic cells after the first plating. GRB2 is shown as the loading control. n=2 B) Western blot analysis of HIF1a hydroxylation and PHD2 after the first plating. Densitometry is showed relative to WT. GRB2 is displayed as the loading control. n=2 C) Colony forming units over 6 generations in wild type cells transduced with MPLW515L, HIF1a WT, HIF1a PP/AA mutant and the various combinations. The average plus/minus SEM are shown, n=2 D) Comparison of mitochondrial ROS in cells at platings 1, 3 and 6. Representative flow and the average plus/minus SEM are shown. E) (Left) Western blot analysis of protein levels in MPLW515L/Stk11-null cells after treatment with various small molecules known to target HIF1a stabilization. Actin is shown as a loading control. (Right) Effect of small molecules on colony formation capacity of MPLW515L/Stk11-null cells. The average plus/minus SD are shown. P values by Dunnet’s multiple comparisons test against DMSO control. F) Effect of N-acetylcysteine (NAC) on the colony re-plating phenotype. No significant differences were observed. The average plus/minus SEM are shown, n=3

