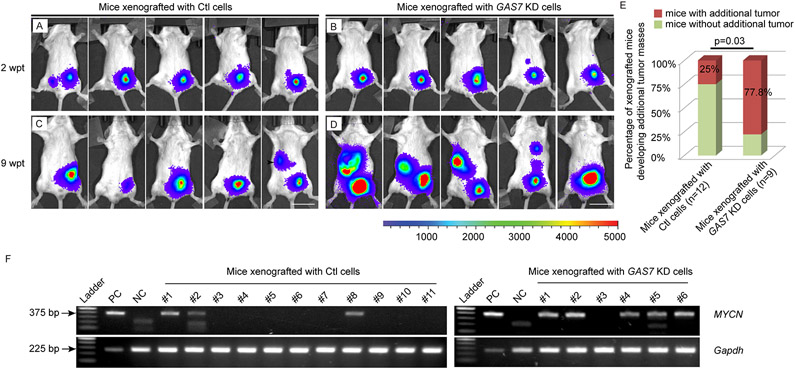
Figure 7. Knockdown of GAS7 promotes bone marrow metastasis of NB cells in xenografted SCID mice.
(A-D) Representative bioluminescence imaging of mice injected with luciferase-expressing BE(2)-M17 cells infected with control shRNA- (Ctl, A and C) or GAS7 shRNA (GAS7 KD, B and D) at 2 weeks or 9 weeks post-transplantation (wpt). Colored scale bar represents intensity of bioluminescence in counts. Scale bars, 2cm.
(E) Fraction of xenografted mice developed additional tumor masses away from the engrafted primary tumors at 9 wpt. The difference in the percentage of mice developed additional tumor masses in animals xenografted with control (Ctl) cells versus GAS7 KD cells is significant by Fisher’s exact test at p=0.03.
(F) Gel electrophoresis of PCR product of MYCN genotyping. Left, bone marrow from mice transplanted with control shRNA-infected-BE(2)-M17 NB cells, n=11. Right, bone marrow from mice transplanted with GAS7shRNA-infected-BE(2)-M17 NB cells, n=6. The expression levels of Gapdh serve as a loading control. Positive control (PC) was using gDNA from BE(2)-M17 NB cells as a template. Negative control (NC) was using gDNA from bone marrow of a non-injected SCID mouse as a template. The difference in fraction of mice with detection of MYCN-positive tumor cells in bone marrow of animals xenografted with control (Ctl) cells versus GAS7 KD cells is significant by Fisher’s exact test at p=0.05.

