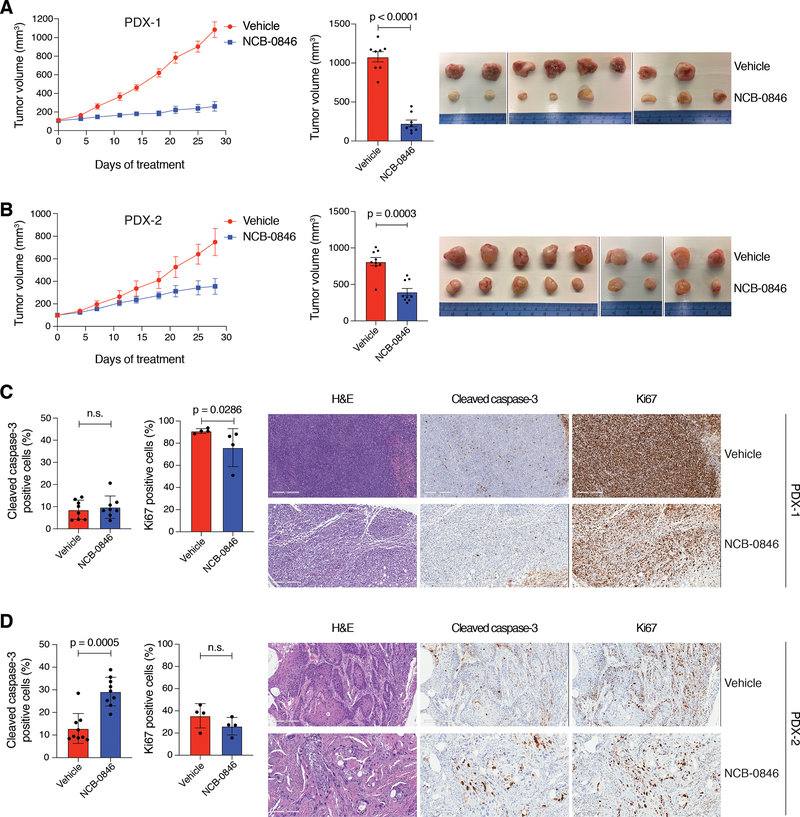
Figure 3. Preclinical evaluation of TNIK inhibitor NCB-0846 in LSCC PDX.
A. (Left) Tumor growth curve of PDX-1 treated with NCB-0846 (100 mg/kg, b.i.d., five days on/two days off). Mean tumor volumes ± SEM are shown. (Center) Average tumor volume at the end of treatment, mean ± SEM. n = 8 mice/group; two-tailed t-test. (Right) Tumor images from the study at the end of treatment. B. (Left) Tumor growth curve of PDX-2 treated with NCB-0846 (100 mg/kg, b.i.d., five days on/two days off). Mean tumor volumes ± SEM are shown. (Center) Average tumor volume at the end of treatment, mean ± SEM. n = 9 mice/group; two-tailed Mann-Whitney test. (Right) Tumor images from the study at the end of treatment. C. (Left) Immunohistochemistry (IHC) analysis of apoptosis (cleaved caspase-3; n = 8/group) and proliferation (Ki67; n = 4/group) in PDX-1 cell xenografts. Data are represented as mean ± SD; two-tailed Mann–Whitney test. (Right) Representative H&E and cleaved caspase-3 and Ki67 IHC images from each treatment group. D. IHC analysis of apoptosis (cleaved caspase-3; n = 9/group) and proliferation (Ki67; n = 4/group) in PDX-2 cell xenografts. Data are represented as mean ± SD; two-tailed Mann–Whitney test. (Right) Representative H&E and cleaved caspase-3 and Ki67 IHC images from each treatment group. n.s., not significant. Scale bar = 300 μm.

