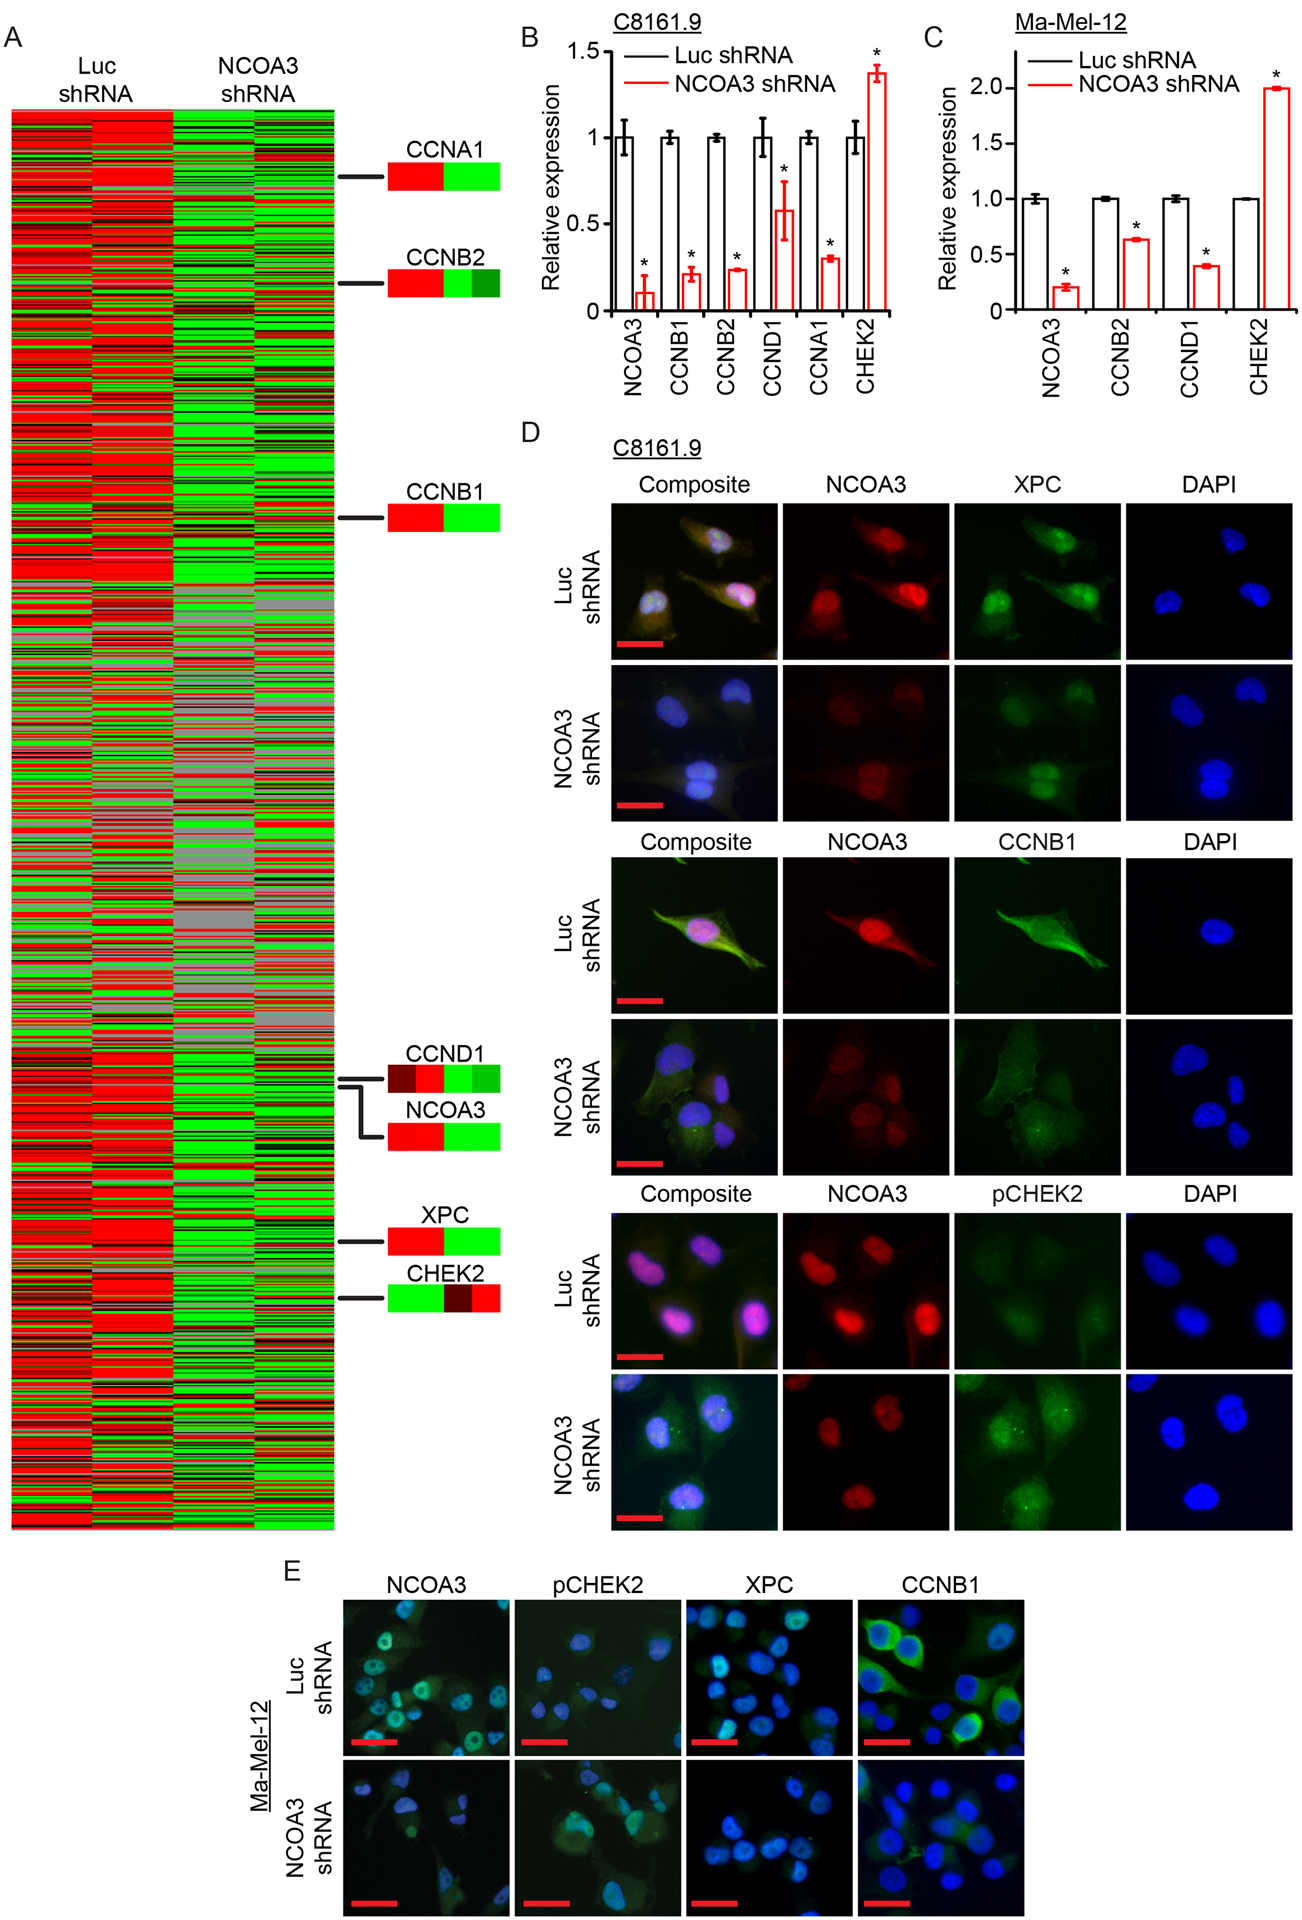
Fig. 3. Microarray analysis and identification of genes in the NCOA3 signal transduction pathway in melanoma cells.

(A) Gene expression profiles using supervised hierarchical analysis of duplicate clones of C8161.9 cells stably expressing anti-luc shRNA (1 and 2) or anti-NCOA3 shRNA (3 and 4). Nodes of gene expression selected demonstrating differential expression of various genes. (B) Quantitative RT-PCR of expression of various genes (in triplicate) in C8161.9 cells stably expressing anti-luc shRNA or anti-NCOA3 shRNA. (C) Quantitative RT-PCR of expression of various genes (in triplicate) in Ma-Mel-12 cells stably expressing anti-luc shRNA or anti-NCOA3 shRNA. (D) Representative images of immunofluorescence detection of various proteins in C8161.9 cells stably expressing anti-luc shRNA or anti-NCOA3 shRNA (quantitation provided in Fig. S3A). (E) Representative images of immunofluorescence detection of various proteins in Ma-Mel-12 stably expressing anti-luc shRNA or anti-NCOA3 shRNA (quantitation provided in Fig. S3B). * denotes statistically significant differences compared with control. All scale bars are 20 μm.
