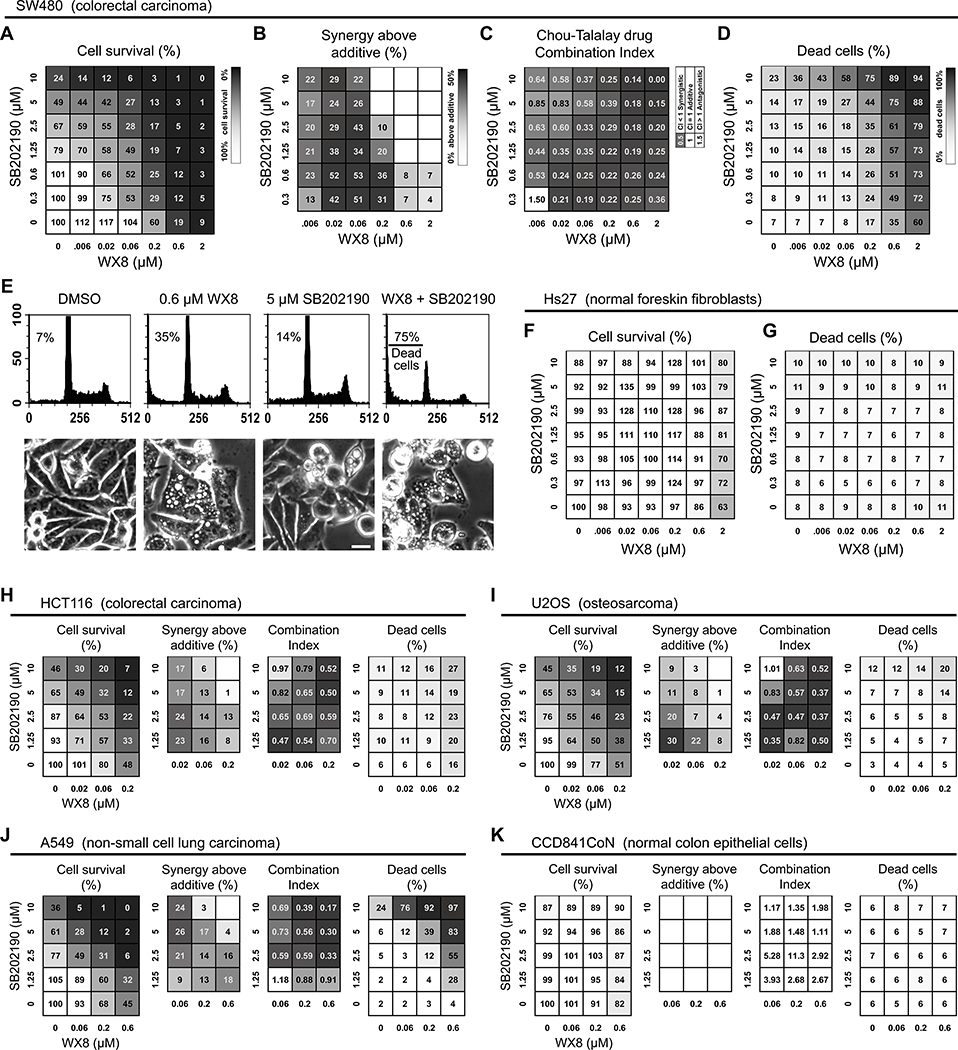
Figure 3. p38MAPK and PIKfyve inhibitors synergistically and selectively reduce cancer cell viability.
(A) WX8 and SB202190 dosage matrix was performed with SW480 cells cultured for 3 days with the indicated drug concentrations. All cells were collected, counted and analyzed by FACS. The number of viable cells for each treatment was presented as a percentage from the control viable cells “Cell Survival (%)”. (B) “Synergy above additive” was calculated by subtracting the individual toxicities of WX8 and SB202190 from the toxicity of their combinations. Positive numbers indicate a synergistic effect above the expected additive effect. (C) The Chou-Talalay Combinational Index (CI) was calculated for each WX8 and SB202190 combination in panel A. The smaller the CI, the larger the synergistic effect. (D) “Dead cells (%)” indicate the percentage of dead cells in the population for each treatment. (E) Examples of FACS generated DNA size histograms with the percentage of dead cells and phase contrast images of cells treated with the indicated drugs. Scale bar: 20 μm. (F) “Cell Survival (%)” and (G) “Dead cells (%)” results from a WX8 and SB202190 dosage matrix generated with Hs27 cells under the same conditions used in panels A. (H to K) Results from WX8 and SB202190 dosage matrices performed with the indicated cell lines. Values are mean (n = 3). Total cell count and SEM for each treatment is presented in Fig. S5.

