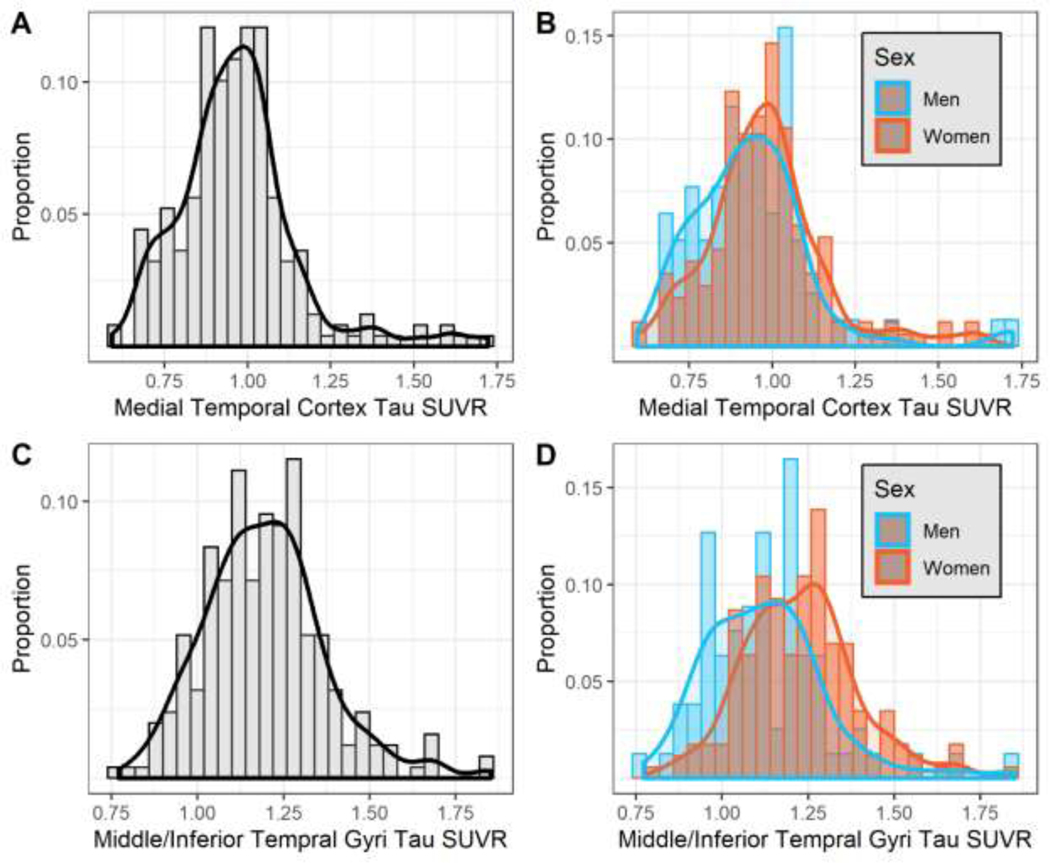
Figure 2. Distribution of tau SUVR, overall and by sex subgroups.
Black lines in Panels A and C represent non-parametric kernel density estimations for the corresponding tau SUVR measure in the overall sample. Red and blue lines in Panels B and D represent non-parametric kernel density estimations for the corresponding sex within each tau SUVR measure.

