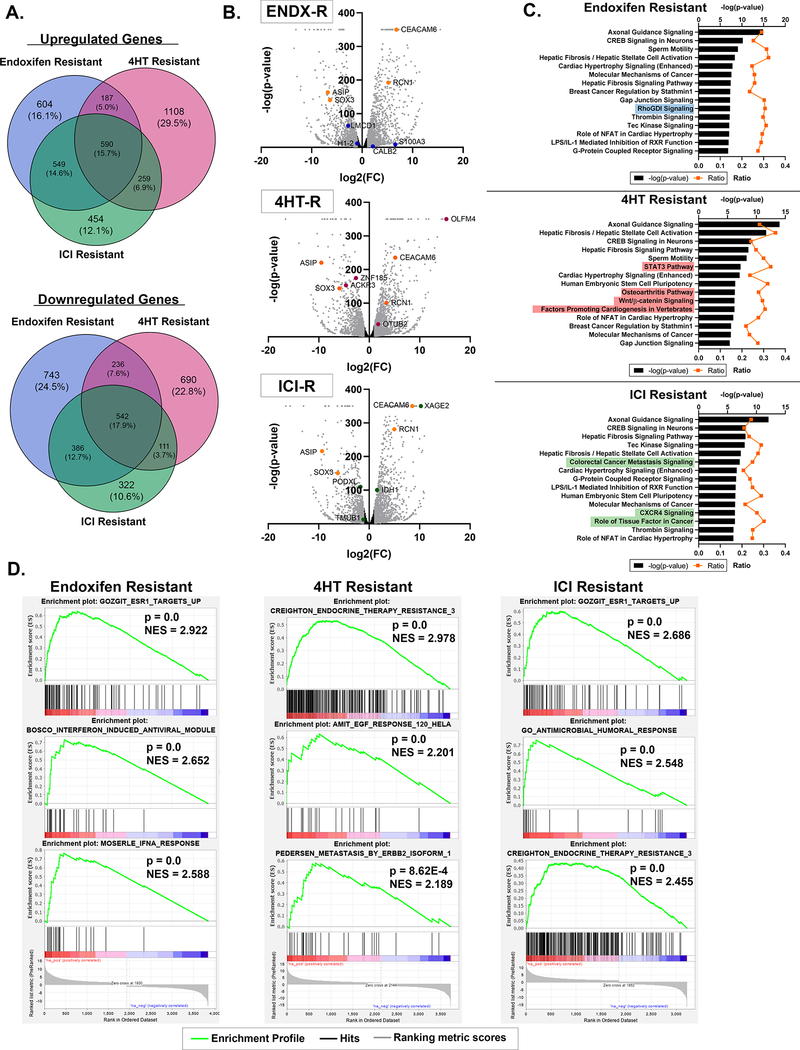
Figure 3. Global gene expression profiles of MCF7 resistant cell lines.
A. Venn diagrams indicating overlap of upregulated (top) and downregulated (bottom; fold change >2; p<0.05) genes in ENDX-R, 4HT-R, and ICI-R cells, relative to vehicle control cells, as detected by RNA-seq. B. Volcano plots depicting gene expression changes in each resistant cell line, with differentially-regulated genes (fold change >2; p<0.05) colored grey. Randomly selected genes for PCR validation are highlighted in orange (differentially regulated in all 3 cell lines), blue (unique to ENDX-R), pink (unique to 4HT-R), or green (unique to ICI-R). Differentially regulated genes were subjected to Ingenuity Pathway Analysis (C) and Gene Set Enrichment Analysis (D). Pathways unique to each cell line are highlighted in blue, red, or green. NES: normalized enrichment score.

