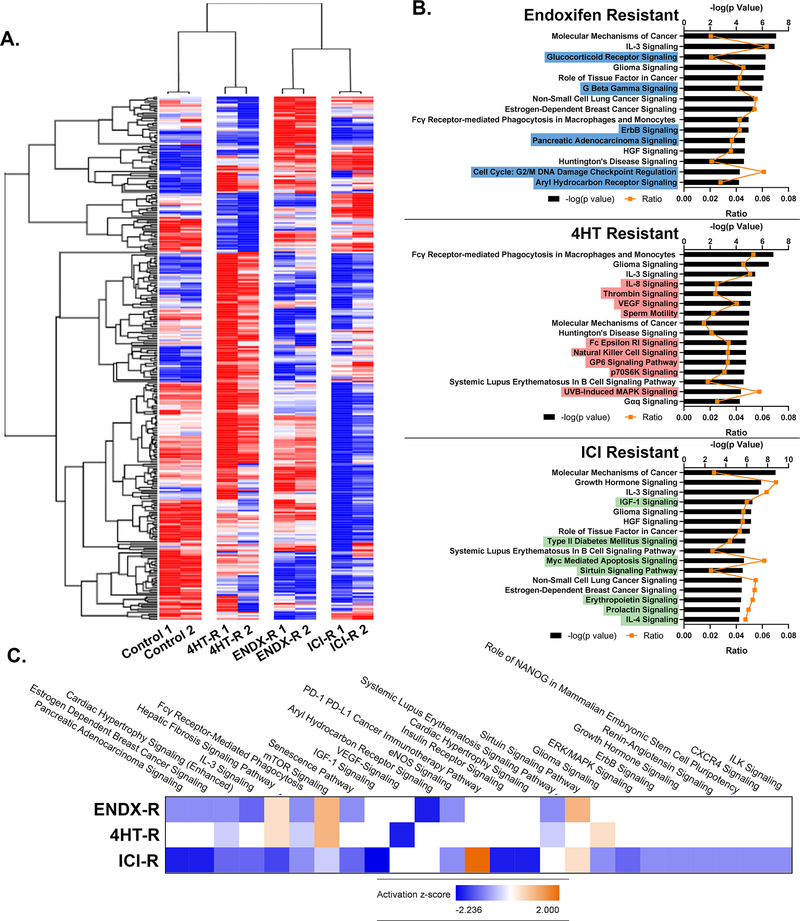
Figure 4. RPPA analysis of MCF7 resistant cell lines.
A. Heat map indicating relative expression of all proteins and phosphoproteins analyzed in ENDX-R, 4HT-R, and ICI-R cell lines relative to vehicle control cells. Hierarchical clustering of proteins is shown on the left, while unsupervised clustering of individual replicates is shown on the top. B. Ingenuity Pathway Analysis of differentially expressed proteins, with the top 15 pathways shown for each cell line. Pathways unique to each cell line are highlighted in blue, red, or green. C. Results of IPA analysis comparing top pathways from differentially expressed proteins in each resistant cell line.

