
Figure 5. Flow cytometry analysis of tumor-infiltrating innate immune cell populations of anti-PD-1 treated tumors.
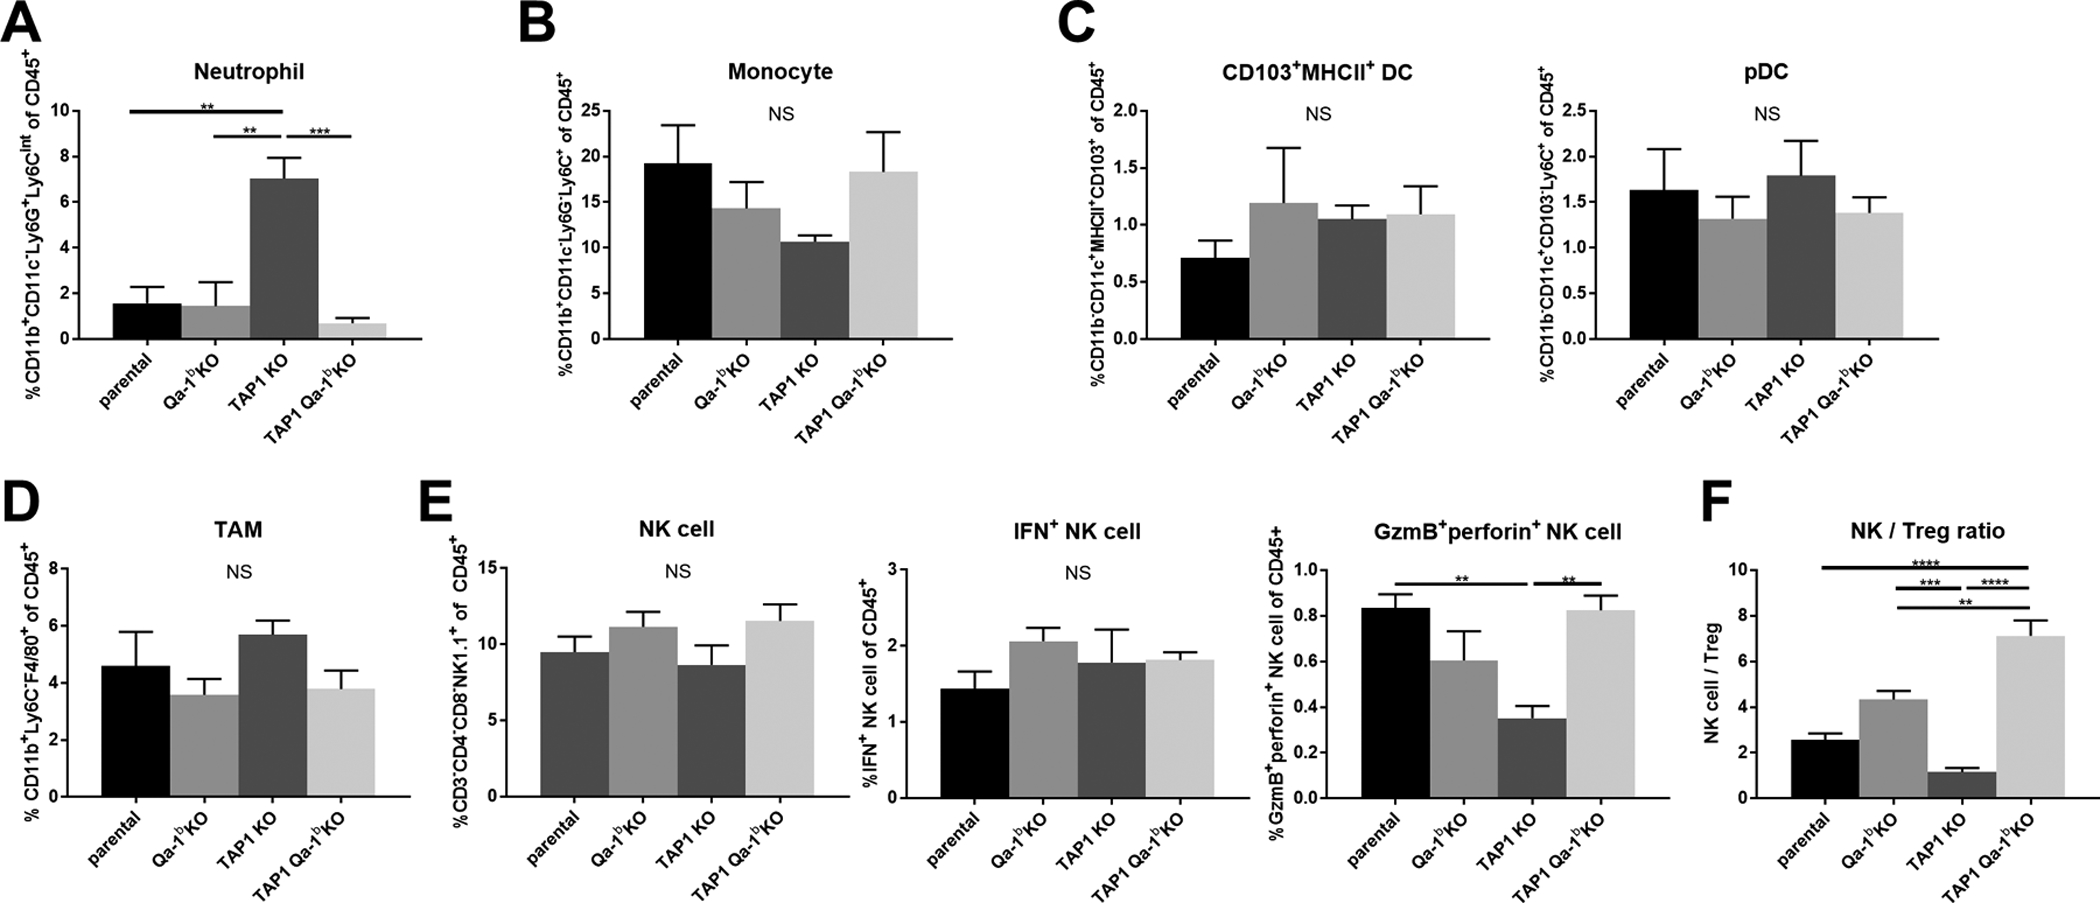
Mice were euthanized between days seven and ten post-randomization. Tumors were excised, dissociated, and stained with a pre-optimized adaptive immune marker panel. Frequency for each KO is shown: (A) neutrophils (B) monocytes (C) dendric cells (D) macrophages. (E) natural killer cells and their functional status. Data are shown in mean ± SEM (n=4). (F) NK cell / Treg ratios. Values represent mean ± SEM (n=4). Statistical significance was determined using one-way ANOVA and Tukey’s post-hoc test. *p<0.05, **P<0.01, ***p<0.001, ****P<0.0001.