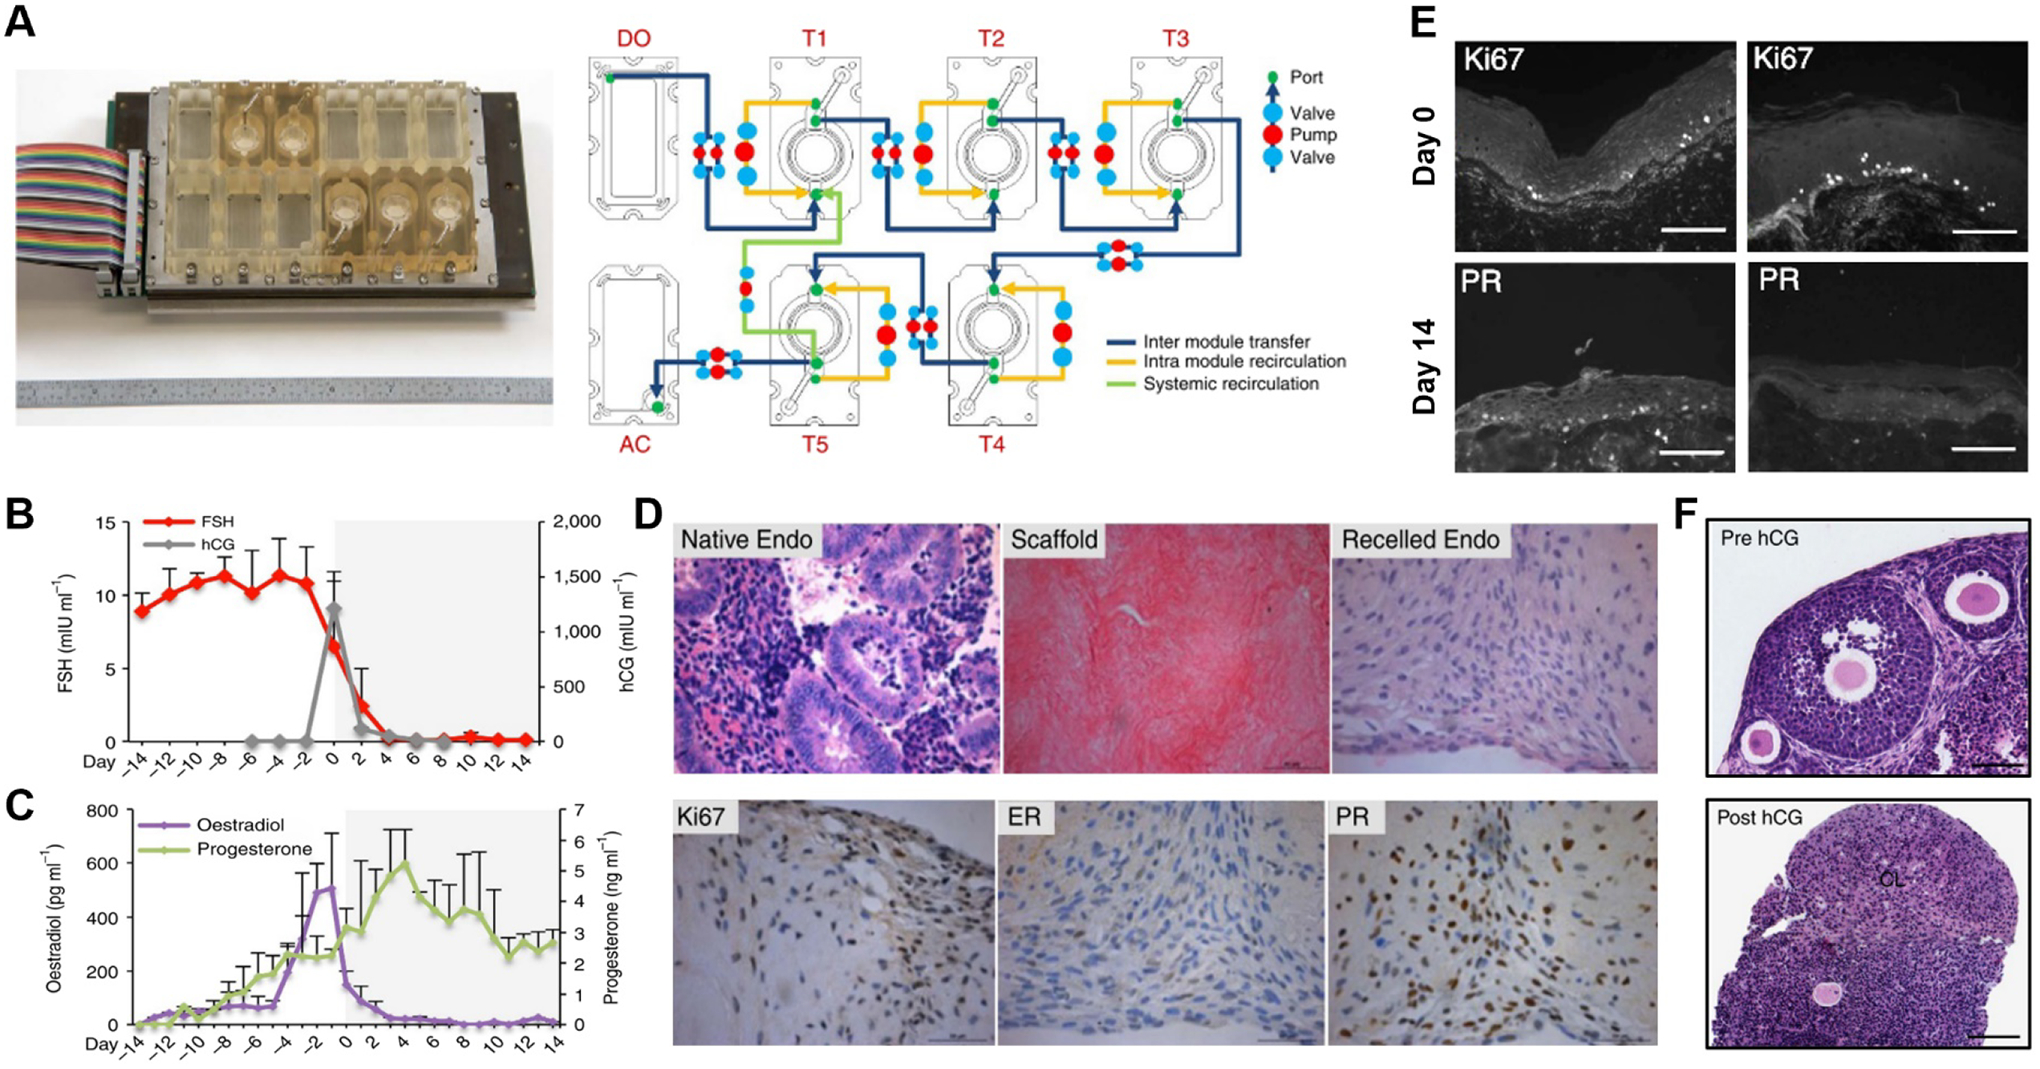
Figure 7.

EVATAR [120]. (A) Device photo (left) and schematic representation of interconnected culture modules (right). Dark blue, yellow, and green lines show inter module transfer, intra module recirculation, and systemic recirculation, respectively. DO = donor module, AC = acceptor module, T= tissue module. (B) Follicle stimulating hormone (FSH) and human chorionic gonadotropin (hCG) concentration and (C) oestradiol and progesterone concentration in the device over 28 days of culture. (D) Human endometrium tissue before and after decellularization, and after recellularization (top). Immunohistochemical staining of Ki67, estrogen receptors (ER), and progesterone receptors (PR) in recellularized endometrial scaffolds on day 14 (28 days of microfluidic culture). (E) Ki67 and PR staining in ectocervical tissue at the end of the follicular (day 0) and luteal (day 14) phases. Scale bars: 10 μm. (F) Histology of ovarian tissue on day 0 (Pre hCG, top) and day 8 (Post hCG, bottom) showing corpus luteum (CL) formation. Scale bars: 100 μm. Adapted with permissions from original publication.
