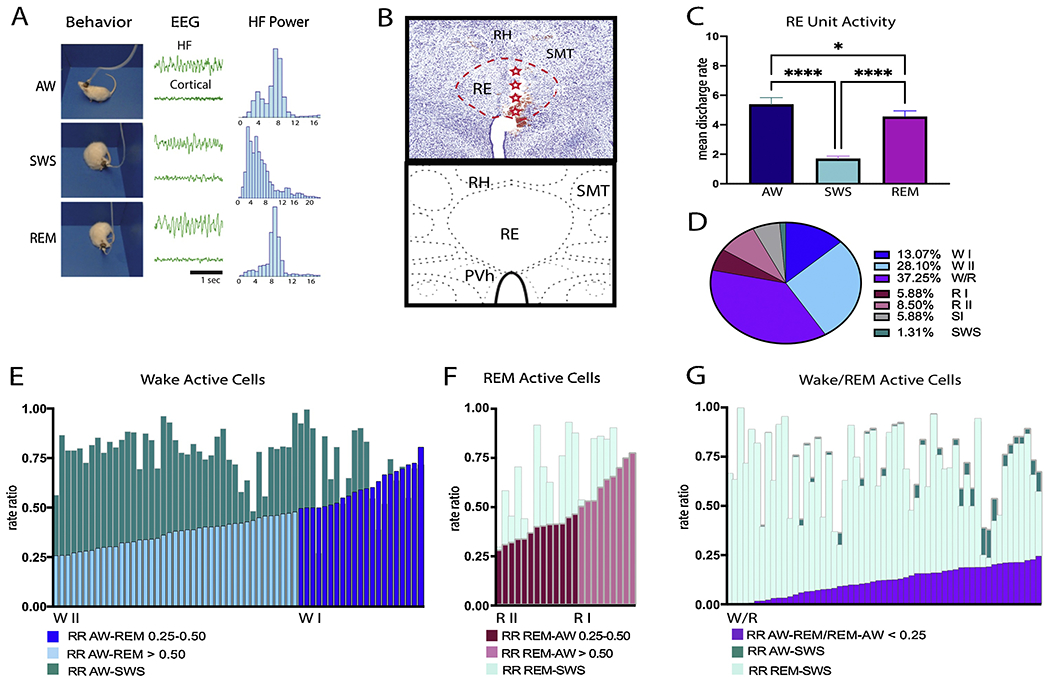
Figure 1.

A: Awake-sleep state periods were identified and confirmed using the following parameters: cortical EEG, hippocampal (HF) LFP and recorded behavior. Left: Video snapshots demonstrating an example of a rat’s behavior during active wake, slow wave sleep and REM states during one of the recording sessions. Middle: HF LFP (top) and cortical EEG activity corresponding to the snapshot on the left. Right: HF LFP spectral analysis for each state showing a prominent theta rhythm in waking and REM sleep. B. High magnification photomicrograph (top) of a coronal section through the nucleus reuniens (RE) (red dashed lines) showing the electrode track and recording sites along it (red stars) for a representative case at a mid-level of the thalamus, depicted in the schematic coronal section (bottom). Adapted from Swanson (2018). C. Bar graph illustrating the mean discharge rates across sleep-wake states for all recorded units of nucleus reuniens (RE). D. Pie chart showing relative percentages of RE cells identified in RE based on their patterns of discharge profile across sleep-wake states using rate ratios (RR): Wake active I (WI) and II (WII), REM active I (RI) and II (RII), Wake/REM active (W/R), state independent (SI), and SWS cells. E-G: Detailed stacked histograms of the RR for wake active (E), REM active (F) and W/R cells. The RR was calculated as (AW-REM)/REM and (AW-SWS)/SWS for wake active neurons (E). WI cells (dark blue) were defined as having a RR AW-REM > 0.50 while WII cells (light blue) had a RR AW-REM > 0.25 but < 0.50. The majority of wake active neurons exhibited RR AW-SWS (teal) of > 0.50%. The RR of REM active neurons was calculated using (REM-AW)/REM and (REM-SWS)/REM (F). RI cells had a RR REM-AW > 0.50 (light pink). RII cells had a RR AW-REM > 0.25 but < 0.50 (dark pink). All REM active cells had RR REM-SWS that were > 0.25 (light teal). Wake/REM (W/R) cells were defined by having a RR for AW-SWS (dark teal) and REM-SWS (light teal) of > 0.25 and exhibiting a RR value between AW and REM (AW-REM)/AW or (REM-AW)/REM (purple) of < 0.25 (G). Most W/R cells had RR for AW-SWS (dark teal) and REM-SWS (light teal) > 0.50. Each bar in the histograms (E-G) represents a single recorded unit. Significance value: * p < 0.05; **** is p < 0.0001. Error bars represent SEM. Abbreviations: PVh, paraventricular nucleus of hypothalamus; RH, rhomboid nucleus of thalamus; SMT, submedial nucleus of thalamus.
