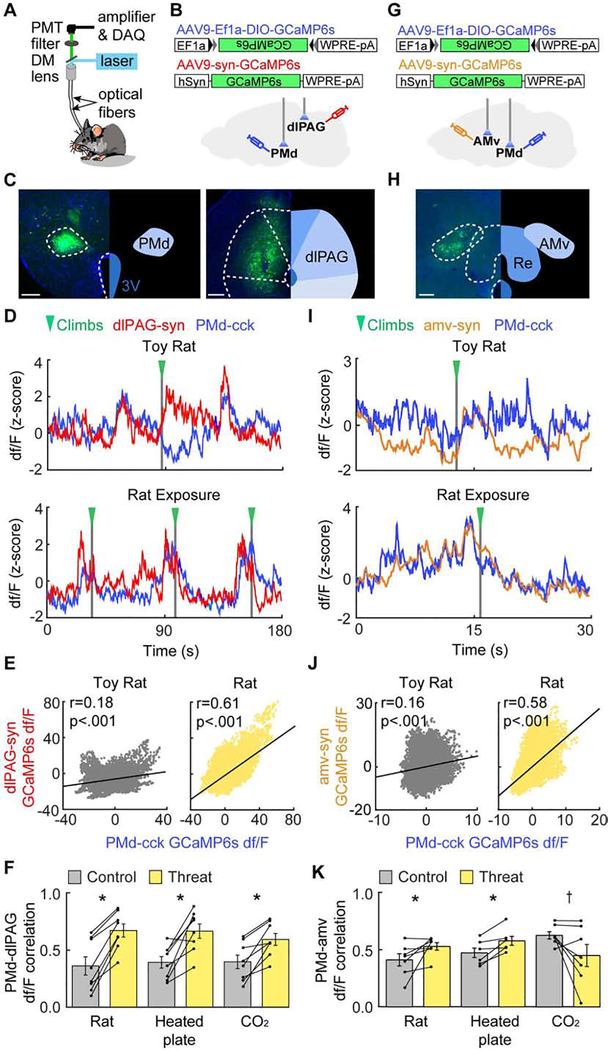
Figure 4. The PMd-cck→dlPAG-syn circuit becomes more synchronized during threat assays, while the PMd-cck→amv-syn circuit becomes more synchronized only in assays requiring context-specific escape.
(A) Dual-site fiber photometry setup.
(B) Strategy to express CGaMP6s in PMd-cck cells and dlPAG-synapsin cells.
(C) Histology of GCaMP6s expression in the PMd (left) and the dlPAG. (right; PMd scale bar: 200μm; dlPAG scale bar: 150μm)
(D) PMd-cck and dlPAG traces from toy rat and rat assays.
(E) PMd-cck and dlPAG signals were more correlated during rat than toy rat exposure. (Spearman correlation rs: toy rat: rs=.177, p<0.001; rat: rs=.612, p<0.001)
(F) Average bar plot showing PMd-cck and dlPAG activity were more correlated during threat than control (toy rat, unheated floor and air) exposure. (n=8 threat assays, Wilcoxon rank-sum test,*p < 0.05)
(G) Strategy to express CGaMP6s in PMd-cck cells and anterior medial ventral thalamus (amv)-synapsin cells.
(H) Histology of GCaMP6s expression in the amv. (scale bar: 150μm)
(I-K), Same as (D-F), but for mice expressing CGaMP6s in PMd-cck cells and amv-synapsin cells. (n=7 for rat, CO2 and controls; n=6 for heated plate and control)
(J) Spearman correlation rs: toy rat: rs=.164, p<0.001; rat: rs=.583, p<0.001.
(K) Wilcoxon rank-sum test, *p<0.05, † p=0.078.

