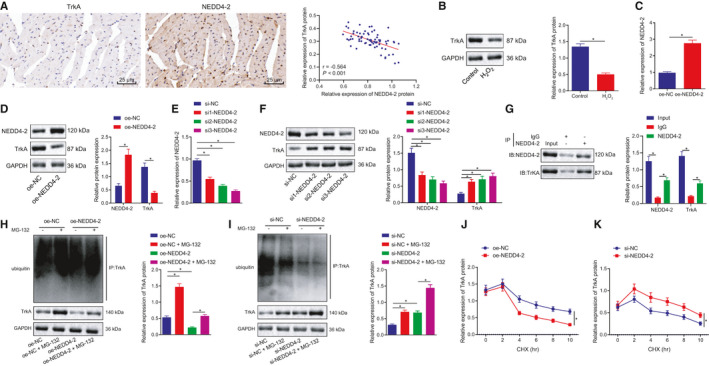
FIGURE 5.

NEDD4‐2 specifically binds to TrkA receptor protein and stimulates the ubiquitination and degradation of TrkA protein in H9c2 cells. A, Correlation analysis between the expression of NEDD4‐2 and miR‐454 determined with immunohistochemistry. B, The protein expression of TrkA in control H9c2 cells or H9c2 cells treated with H2O2 for 12 h as measured by Western blot assay; *P < .05. C, The mRNA expression of NEDD4‐2 in H9c2 cells treated with oe‐NC or oe‐NEDD4‐2 determined by RT‐qPCR 48 h after transfection; *P < .05. D, The protein expression of NEDD4‐2 in H9c2 cells treated with oe‐NC or oe‐NEDD4‐2 determined by Western blot assay 48 h after transfection; *P < .05. E, The mRNA expression of NEDD4‐2 in H9c2 cells treated with si‐NC, si1‐NEDD4‐2, si2‐NEDD4‐2 and si3‐NEDD4‐2 determined by RT‐qPCR 48 h after transfection; *P < .05. F, The protein expression of NEDD4‐2 and TrkA in H9c2 cells treated with si‐NC, si1‐NEDD4‐2, si2‐NEDD4‐2 and si3‐NEDD4‐2 determined by Western blot assay 48 h after transfection; *P < .05. G, The binding of NEDD4‐2 to TrkA in H9c2 cells determined by Co‐IP assay. H, The ubiquitination level of TrkA protein in H9c2 cells upon NEDD4 overexpression 48 h after transfection. I, The ubiquitination level of TrkA protein in H9c2 cells upon NEDD4 silencing 48 h after transfection. J, The TrkA protein halflife determination in H9c2 cells upon NEDD4 overexpression 48 h after transfection. K, The TrkA protein half‐life determination in H9c2 cells upon NEDD4 silencing 48 h after transfection. Measurement data are displayed as mean ± standard deviation. Independent sample t‐tests were used for comparing data between the two groups, and one‐way ANOVA for comparison of data among multiple groups. Pearson's correlation analysis was performed for observation of the correlation between TrkA and NEDD4‐2 protein expression. Each cell experiment was repeated three times
