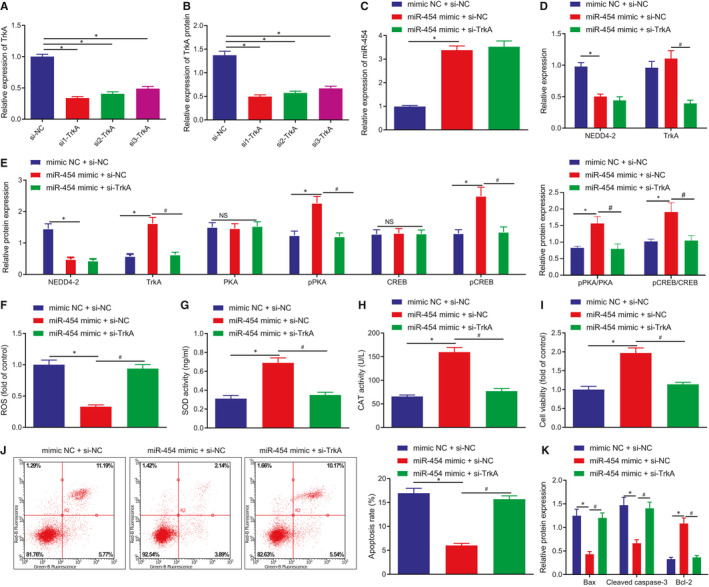
FIGURE 6.

miR‐454 upregulates TrkA to inhibit H9c2 cell apoptosis and injury by targeting NEDD4‐2. A, The mRNA of TrkA in H9c2 cells treated with si‐NC, si1‐TrkA, si2‐TrkA or si3‐TrkA determined by RT‐qPCR 48 h after transfection; */# P < .05. B, The protein expression of TrkA in H9c2 cells treated with si‐NC, si1‐TrkA, si2‐TrkA or si3‐TrkA determined by Western blot assay 48 h after transfection; */# P < .05. In panels C–K, H9c2 cells were treated with mimic NC + si‐NC, miR‐454 mimic + si‐NC or miR‐454 mimic + si‐TrkA for 48 h. C, The expression of miR‐454 in H9c2 cells determined by RT‐qPCR; */# P < .05. D, The mRNA expression of NEDD4‐2 and TrkA in H9c2 cells determined by RT‐qPCR; */# P < .05. E, The protein expression of NEDD4‐2 and TrkA and the extents of PKA and CREB phosphorylation in H9c2 cells determined by Western blot assay; */# P < .05. F, ROS levels in H9c2 cells; */# P < .05. G, The activities of SOD in H9c2 cells as examined by ELISA; */# P < .05. H, The activities of CAT in H9c2 cells as measured by ELISA; */# P < .05. I, The survival rates of H9c2 cells as examined by MTT assay; */# P < .05. (J) The apoptotic rates of H9c2 cells as examined by flow cytometry; */# P < .05. K, The protein expression of Bax, cleaved caspase‐3 and Bcl‐2 in H9c2 cells determined by Western blot assay; */# P < .05. Measurement data are displayed as mean ± standard deviation. One‐way ANOVA was performed for comparison of data among multiple groups. Each cell experiment was repeated three times
