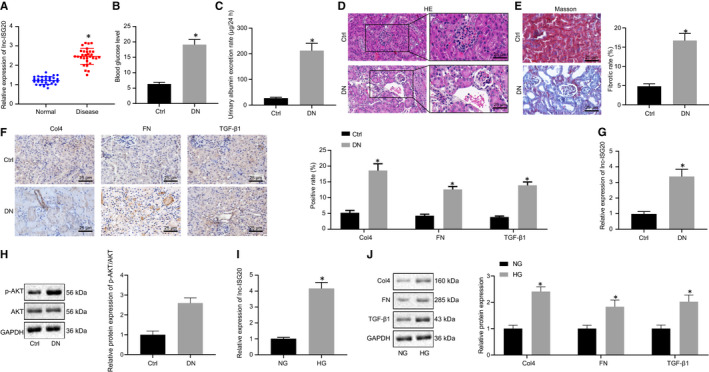
FIGURE 1.

Lnc‐ISG20 is highly expressed in DN patients, DN mouse kidney tissues and cell models. A, RT‐qPCR determination of the relative expression of lnc‐ISG20 in the normal kidney tissues of the control group (n = 30) and kidney tissues of DN patients (n = 30). B, Blood glucose levels in the control and DN mice. C, Urinary albumin excretion rate in the control and DN mice. D, HE staining showing pathological conditions of the kidney tissues in the control and DN mice. E, Masson staining displaying collagen fibres of kidney tissues in the control and DN mice. F, Immunohistochemistry for detection of protein expression of collagen IV, fibronectin and TGF‐β1 in the kidney tissues of the control and DN mice. G, RT‐qPCR determination of the relative expression of lnc‐ISG20 in kidney tissues of control mice (n = 10) and DN mice (n = 10). H, The expression of p‐AKT and total AKT proteins in kidney tissues of control mice (n = 10) and DN mice (n = 10) measured by Western blot assay. I, RT‐qPCR determination of the expression of lnc‐ISG20 in MCs under NG or HG condition. J, The protein expression of collagen IV, fibronectin and TGF‐β1 in MCs under NG or HG condition measured by Western blot assay. *P < .05 when compared with the normal tissues, the control mice or NG‐treated MCs (The results are measurement data expressed by mean ± standard deviation. An independent sample t test is used for the analysis between two groups, and the experiment is repeated 3 times)
