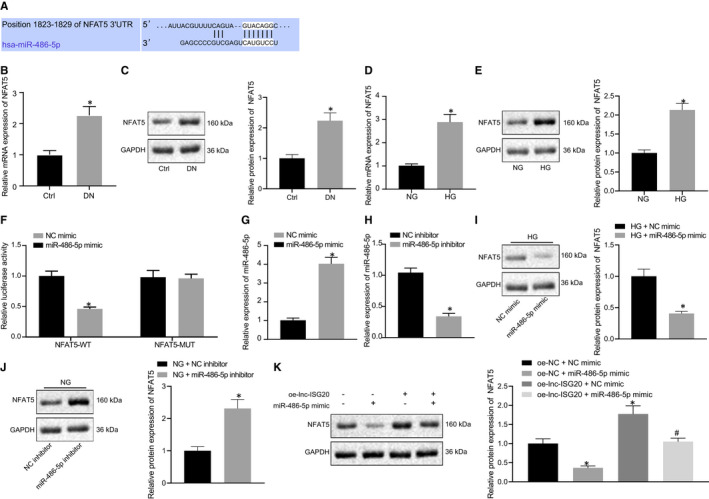
FIGURE 5.

MiR‐486‐5p targets and reduces NFAT5 expression. A, Targetscan showing the binding of miR‐486‐5p to NFAT5. B, The mRNA levels of NFAT5 in kidney tissues of normal mice (n = 10) and DN mice (n = 10) determined by RT‐qPCR. C, The protein levels of NFAT5 in kidney tissues of normal mice (n = 10) and DN mice (n = 10) measured by Western blot assay. D, The mRNA levels of NFAT5 in MCs under NG and HG treatment conditions determined by RT‐qPCR. E, The protein levels of NFAT5 in MCs under NG and HG treatment conditions measured by Western blot assay. F, Verification of the binding of miR‐486‐5p to NFAT5 by dual‐luciferase reporter assay. G, The expression of miR‐486‐5p in MCs after miR‐486‐5p mimic treatment determined by RT‐qPCR. H, The expression of miR‐486‐5p in MCs after miR‐486‐5p inhibitor treatment determined by RT‐qPCR. I, Under HG condition, the mRNA levels of NFAT5 in MCs after miR‐486‐5p overexpression. J, Under NG condition, the mRNA levels of NFAT5 in MCs after inhibition of miR‐486‐5p. K, The protein levels of NFAT5 in MCs after treatment with oe‐lnc‐ISG20/oe‐NC + miR‐486‐5p mimic/NC mimic. *P < .05 compared with Ctrl mice, 293T cells treated with NG, MCs treated with NC mimic, MCs treated with NC inhibitor or MCs treated with oe‐NC + NC mimic. #P < .05 compared with MCs treated with oe‐lnc‐ISG20 + NC mimic (The data results are measurement data expressed by mean ± standard deviation. Independent sample t test was used for analysis between two groups, while one‐way analysis of variance was used for multiple groups followed by Tukey's post hoc test. The experiment was repeated 3 times)
