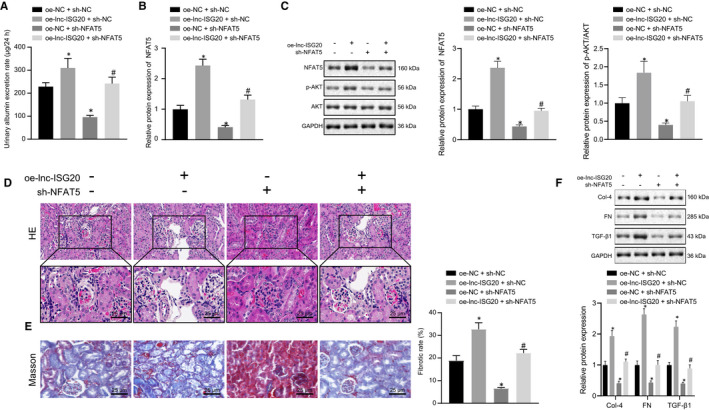
FIGURE 8.

Lnc‐ISG20 promotes renal fibrosis in DN mice through miR‐486‐5p/NFAT5/p‐AKT. A, Urinary albumin excretion rate of DN mice after lnc‐ISG20 overexpression and/or NFAT5 silencing together. B, RT‐qPCR determination of the expression of NFAT5 in the kidney tissues of DN mice after lnc‐ISG20 overexpression and/or NFAT5 silencing together. C, Western blot analysis for the protein expression of NFAT5, p‐AKT and AKT in kidney tissues of DN mice after lnc‐ISG20 overexpression and/or NFAT5 silencing together. D, HE staining showing the pathological conditions of kidney tissues of DN mice after lnc‐ISG20 overexpression and/or NFAT5 silencing together. E, Masson staining displaying the collagen fibres in the kidney tissues of DN mice after lnc‐ISG20 overexpression and/or NFAT5 silencing together. F, Western blot analysis for the protein expression of collagen IV, fibronectin and TGF‐β1 in mouse kidney tissues of DN mice after lnc‐ISG20 overexpression and/or NFAT5 silencing together. *P < .05 as compared to the oe‐NC + sh‐NC group. #P < .05 as compared to the oe‐lnc‐ISG20 + sh‐NC group (The data results are measurement data shown by mean ± standard deviation. One‐way analysis of variance was used for comparisons among multiple groups followed by Tukey's post hoc test, and the experiment is repeated 3 times)
