
FIGURE 2.
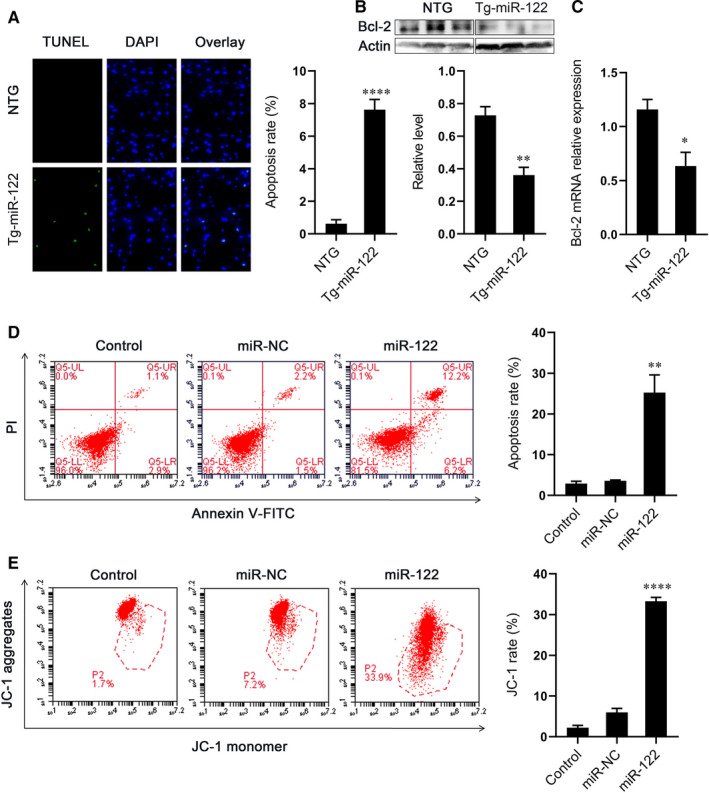
Overexpression of miR‐122 induced apoptosis of cardiomyocytes. (A) Left, representative cardiac sections from NTG and Tg‐miR‐122 mice. Green, TUNEL‐positive myocyte‐nuclei, blue, DAPI‐stained nuclei. Scale bar: 50 μm; right, quantitative analysis of apoptosis. (B) Protein expression of Bcl‐2 in the heart of NTG and Tg‐miR‐122 mice. Top, examples of Western blot bands; bottom, quantitative analysis. (C) mRNA expression of Bcl‐2. (D) Apoptosis in H9C2 cells. Left, representative images of Annexin V‐FITC/PI staining FACS assay. Cells in the lower right quadrant represent early apoptosis and those in the upper right quadrant represent late apoptosis; right, quantitative analysis of cellular apoptosis. (E) Effect of miR‐122 on mitochondrial membrane potential in H9C2 cells. Left, H9C2 cells were gated by flow cytometry with JC‐1. Red fluorescence indicates higher membrane potential; right, quantitative analysis of green/red ratio. N = 5 samples per group. *P < 0.05, **P < 0.01, ****P < 0.001 for all panels vs NTG mice or miR‐NC. An unpaired t test was used to determine statistical significance. Data are means ± SEM