
FIGURE 3.
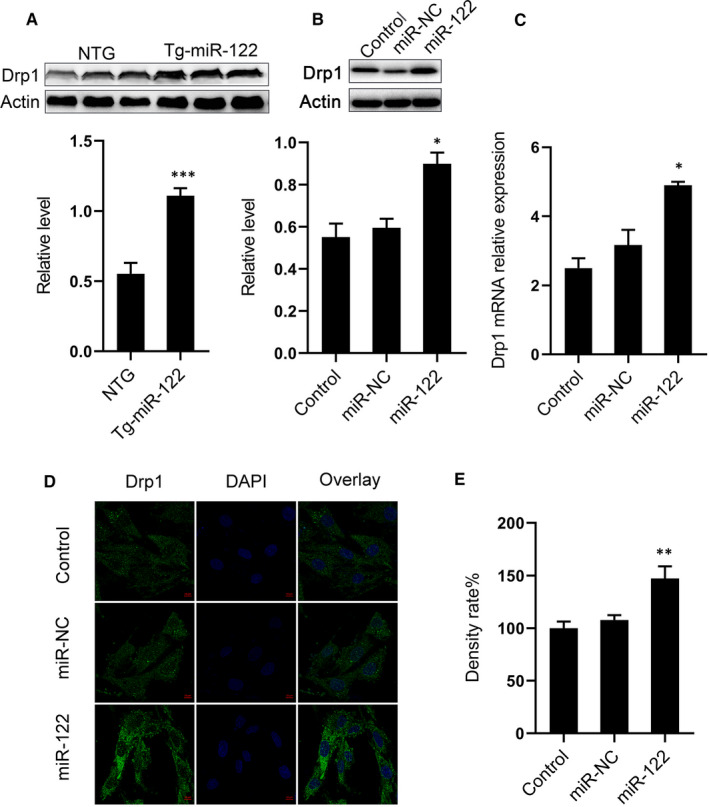
Overexpression of miR‐122 increased protein expression of Drp1. (A) Protein expression of Drp1 in the hearts of NTG and Tg‐miR‐122 mice. Top, Western blot example bands; bottom, quantitative analysis. (B) Protein expression of Drp1 in H9C2 cells transfected with miR‐122 mimics or miR‐NC. Top, examples of Western blot bands; bottom, densitometric analysis of protein level. (C) mRNA expression of Drp1 in H9C2 cells. (D) Representative images of H9C2 cells observed with a laser confocal microscope and cell sections treated with immunofluorescent staining. Scale bar: 50 μm. (E) Quantitative analysis of fluorescence. N = 5 samples per group. *P < 0.05, **P < 0.01, ***P < 0.005 for all panels vs NTG or miR‐NC. An unpaired t test was used to determine statistical significance. Data are means ± SEM