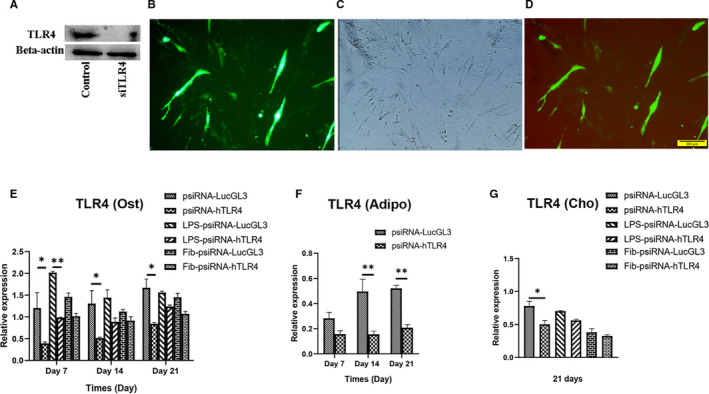
FIGURE 6.

TLR4 silencing by psiTLR transfection. MSCs were transfected with psiTLR4 and psiRNA‐LucGL3 (control). (A) TLR4 levels in the TLR4 knockdown and control groups were detected through western blotting. MSCs were transfected with psiTLR4, transfection of hMSCs with psiTLR4 was confirmed using (B) fluorescence microscope, and (C) light microscope (Scale bar = 200 mm). (D) merged state is shown. TLR4 expression after knockdown of TLR4 in MSCs during (E) osteogenic, (F) adipogenic, and (G) chondrogenic differentiation was detected using real‐time PCR. Data are presented as mean ± SEM of ratios relative to β‐actin levels (n = 3). *P < .05, **P < .01, ***P < .001, ****P < .0001
