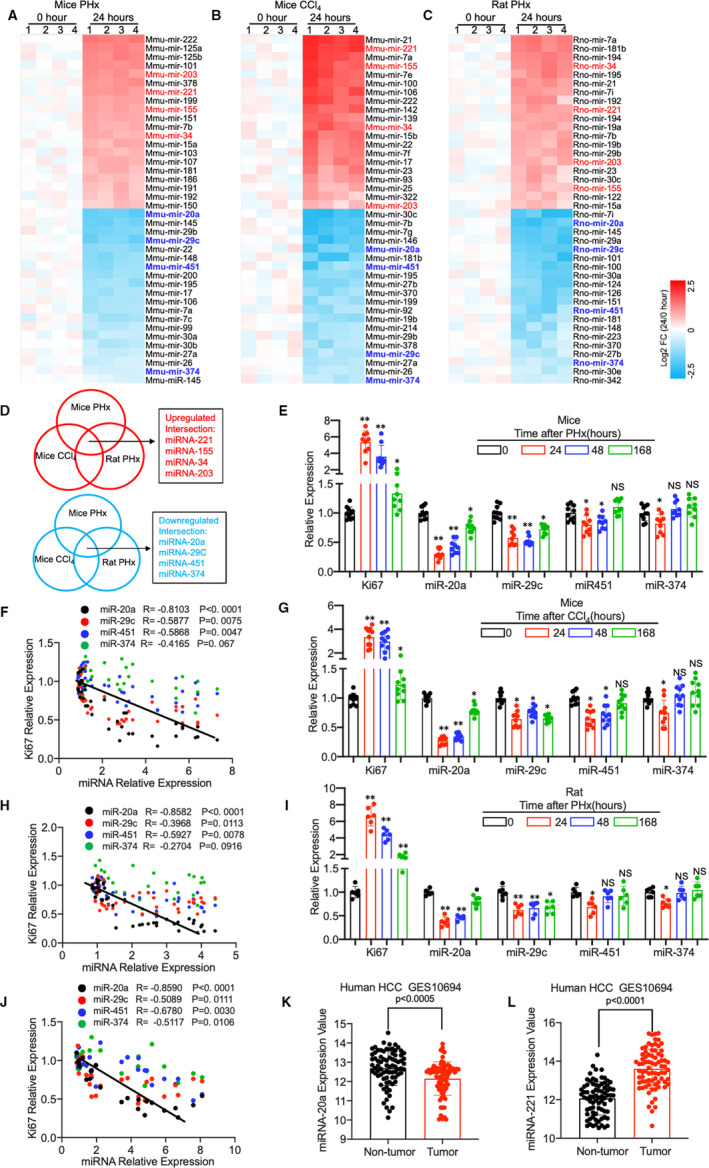
FIGURE 1.

(A‐C) Heat map of the microRNA expression in mouse liver. (A) A liver disease‐related microRNA PCR Array was performed using liver tissue from mice after PHx surgery (24 h vs. 0 h, n = 3 per group). (B) MicroRNA PCR Array results of liver from mice after CCl4 intraperitoneal injection (Comparison between 24 h and 0 h, n = 3). (C) MicroRNA PCR Array was performed using liver from rats after PHx (24 h vs. 0 h, n = 3). (D) The Venn map shows the overlapping expression microRNAs from the three rodent liver regeneration models. (E) Relative expression of Ki67 and miR‐20a, miR‐29c, miR451 and miR374 in the liver of mice at time point 0 h, 24 h, 48 h and 168 h after PHx(0 h group n = 10, 24 h group n = 9, 48 h group n = 9 and 168 h group n = 9; GAPDH was used as a control for mRNA expression, and RNU‐6 was used to normalize microRNA expression). (F) Pearson's correlation coefficient between Ki67 mRNA expression and miR‐20a, miR‐29c, miR451 and miR374 (n = 37 per group). (G) Relative expression of Ki67 and miR‐20a, miR‐29c, miR451 and miR374 in the liver of mice at time point 0 h, 24 h, 48 h and 168 h after CCl4 intraperitoneal injection (n = 10 per group). (H) Pearson's correlation coefficient between Ki67 mRNA expression and miR‐20a, miR‐29c, miR451 and miR374 (n = 40 per group). (I) Relative expression of Ki67 and miR‐20a, miR‐29c, miR451 and miR374 in the liver of rat at time point 0 h, 24 h, 48 h and 168 h after PHx (n = 6 per group). (J) Pearson's correlation coefficient between Ki67 mRNA expression and miR‐20a, miR‐29c, miR451 and miR374 (n = 24 per group). (K, L) miR‐20a and miR‐221 expression in tumour tissue compared with non‐tumour tissue of GSE10694. Data are means ± SEM. *P < .05 and **P < .01
