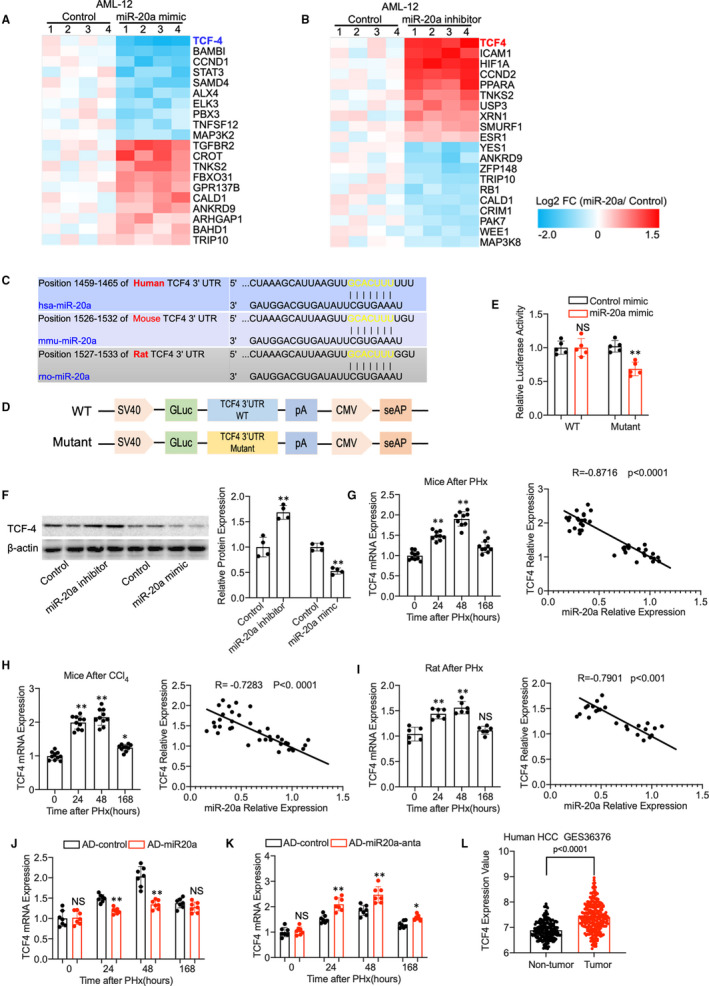
FIGURE 5.

(A) A heat map of differentially expressed genes between miR‐20a mimic and control‐treated AML12 cells using miR‐20a targets PCR array (n = 4). (B) MicroRNA‐20a targets PCR array result shows the differentially expressed genes between miR‐20a inhibitor and control‐treated AML12 cells (n = 4). (C) MicroRNA‐20a‐binding sites on the TCF4 3’UTR region of human and mouse species. (D) Structure of vectors containing wild‐type (WT) and edited TCF4 3’UTR reporter. (E) Luciferase reporter assay confirms the binding of miR‐20a with 3’UTR of the TCF4 gene in the HEK293T cells (n = 5 experimental replicate). (F) Western blot shows the protein level of TCF4 in AML12 cells treated with miR‐20a mimic and inhibitor; β‐actin was used as a loading control. Quantitative measurement of TCF4 protein expression in AML12 cells (n = 4 experimental replicates). (G) TCF4 relative mRNA expression in mice liver after PHx at different time points and Pearson's correlation coefficient between TCF4 mRNA expression and miR‐20a (n = 37). (H) Q‐PCR results show the TCF4 relative mRNA expression in mice liver after CCl4 treatment at different time points. Pearson's correlation coefficient between TCF4 mRNA expression and miR‐20a (n = 40). (I) TCF4 relative mRNA expression in rat liver after PHx at different time points and Pearson's correlation coefficient between TCF4 mRNA expression and miR‐20a (n = 24). (J) Relative TCF4 mRNA expression in AD‐miR20a‐treated mice model of liver regeneration (n = 7 per group). (K) Relative TCF4 mRNA expression in mice model of liver regeneration with AD‐miR20a‐anta pre‐treatment. (n = 7 per group). (L) TCF4 expression in the human hepatocellular carcinoma GSE36376. Data are means ± SEM. *P < .05 and **P < .01
