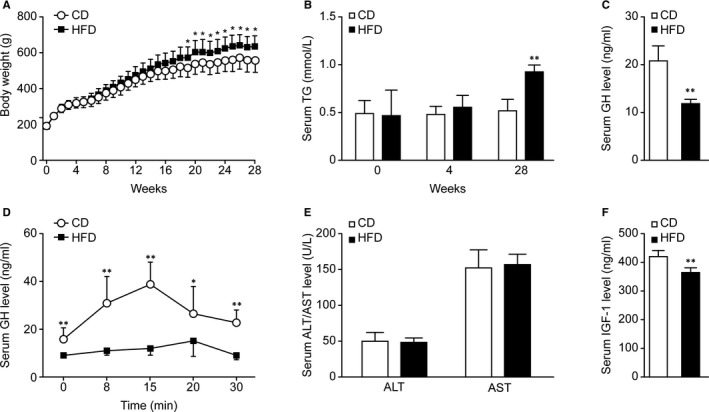
FIGURE 2.

Effect of HFD on body weight, serum TG levels, and the GH/IGF‐1 axis in rats. Rats were fed a CD or an HFD for 28 wk. A, The body weights of the rats were monitored weekly (n = 10). B, The serum TG levels were detected at the 0th, 4th, and 28th weeks (n = 6). C, Basal serum GH levels at the 28th week (n = 5). D, Serum GH concentrations in rats in response to intravenous injection of GHRH (n = 4‐7). E, The serum ALT and AST levels at the 28th week (n = 6). F, Serum IGF‐1 levels at the 28th week (n = 5). *P < .05; **P < .01
