FIGURE 4.

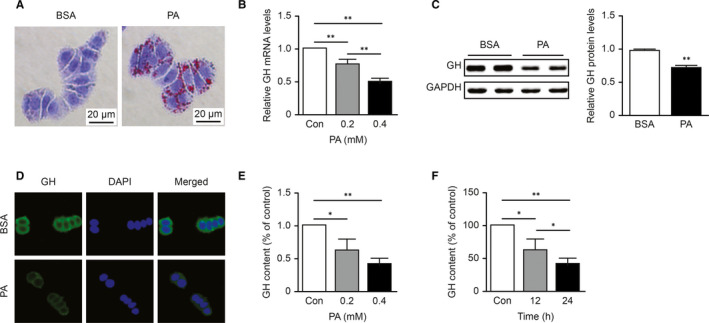
Palmitic acid directly suppressed the synthesis and secretion of GH in GH3 cells. A, Oil Red O staining of GH3 cells treated with BSA or PA (0.2 mmol/L) for 24 h. B, The dose‐dependent effect of PA on the mRNA level of GH in GH3 cells was detected by qPCR (n = 3). C, Western blot analysis of GH protein levels in PA (0.2 mmol/L, 24 h)‐treated GH3 cells (n = 5). D, The cellular distribution of GH (shown in green) after PA treatment (0.2 mmol/L, 24 h) was visualized by immunofluorescence in GH3 cells. The nuclei were stained with DAPI (shown in blue). E,F, Dose‐dependent effect of PA (24 h) and time‐dependent effect of PA (0.2 mmol/L) on GH content in culture supernatant (n = 3).*P < .05; **P < .01
