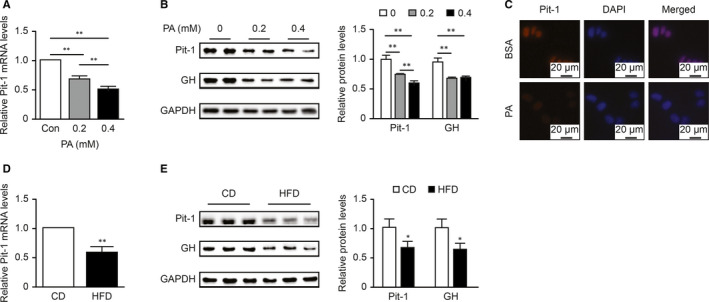
FIGURE 5.

Lipid overload reduced the expression of Pit‐1 in GH3 cells and pituitaries. A, The dose‐dependent effect of PA at 24 h on Pit‐1 mRNA levels in GH3 cells was detected by qPCR (n = 3). B, The dose‐dependent effects of PA at 24 h on Pit‐1 and GH protein levels in GH3 cells were detected by Western blot (n = 4). C, Immunofluorescence staining of Pit‐1 after PA treatment (0.2 mmol/L, 24 h) in GH3 cells. D, qPCR analysis of Pit‐1 mRNA levels in the whole anterior pituitaries of CD and HFD groups (n = 5). E, Western blot analysis of Pit‐1 and GH protein levels in the whole anterior pituitaries of CD and HFD groups (n = 6). The values were quantified by densitometry and normalized to GAPDH values. *P < .05; **P < .01
