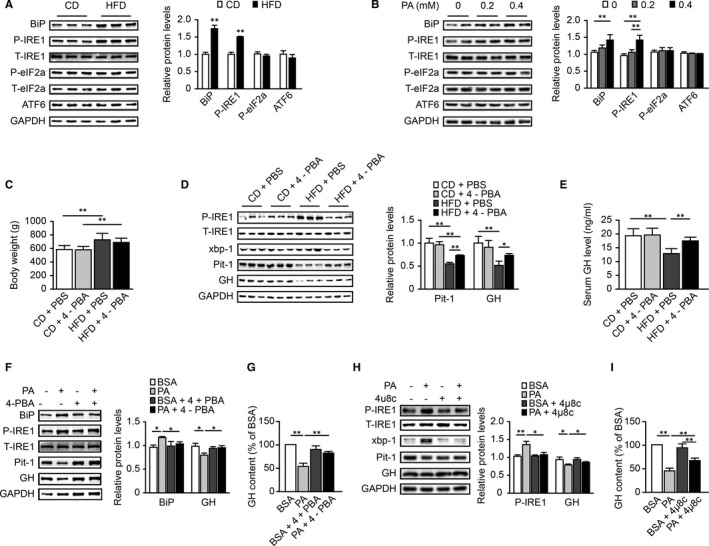
FIGURE 6.

Lipotoxicity triggered ER stress in pituitary somatotrophs, and blocking ER stress or the IRE1α signaling pathway attenuated the decreases in Pit‐1 and GH. A, Western blot analysis of BiP, IRE1α, eIF2α, and ATF6 activation levels in the CD and HFD groups (n = 6). The values were quantified by densitometry. The phosphorylated IRE1α and eIF2α levels were normalized to the respective total protein levels, while the BiP and ATF6 levels were normalized to the GAPDH levels. B, Western blot analysis of BiP, IRE1α, eIF2α, and ATF6 activation levels in GH3 cells treated with PA (0.2 mmol/L or 0.4 mmol/L, 24 h) by Western blot (n = 4). (C‐E), The rats in the CD+4‐PBA and HFD+4‐PBA groups were given 4‐PBA (100 mg/kg/d ip) from the 9th week to the 18th week. The vehicle, PBS, was given correspondingly as a control in the CD+PBS and HFD+PBS groups. C, Body weights of rats (n = 11‐16). D, Western blot analysis of Pit‐1 and GH protein levels and IRE1α and XBP‐1 activation levels (n = 5‐6). The values were quantified by densitometry, and the Pit‐1 and GH levels were normalized to the GAPDH levels. E, Basal GH level of each group (n = 5‐8) (F,G) GH3 cells were cultured with 5 mmol/L 4‐PBA 1 h prior to treatment with PA (0.2 mmol/L, 24 h). F, Western blot analysis of Pit‐1 and GH protein levels and BiP and IRE1α activation levels (n = 3). G, GH content in culture supernatant (n = 3). (H,I) GH3 cells were cultured with 30 μmol/L 4μ8c (inhibitor of IRE1α) 1 h prior to treatment with PA (0.2 mmol/L, 24 h). H, Western blot analysis of Pit‐1 and GH protein levels and IRE1α and XBP‐1 activation levels (n = 3). I, GH content in culture supernatant (n = 3). *P < .05; **P < .01
