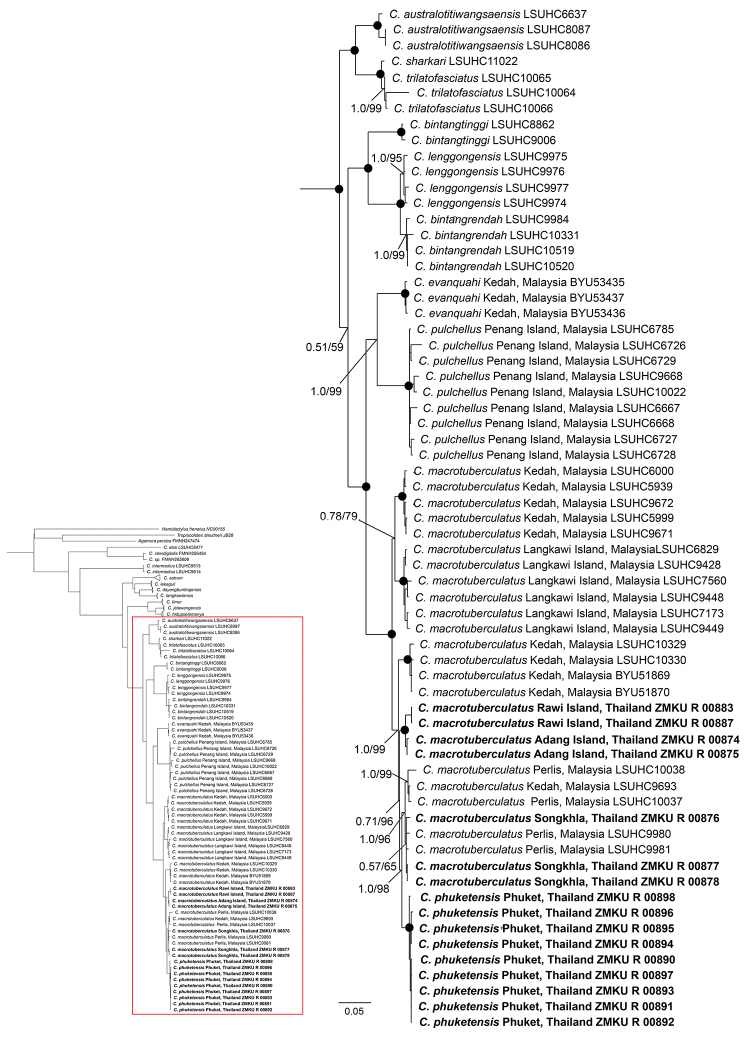
Figure 2.
Reconstructed phylogenetic relationships of the Cyrtodactylus pulchellus complex based on 1,453 bp of ND2 and flanking tRNAs. The phylogenetic tree is from the Maximum Likelihood analysis with Bayesian posterior probabilities (BPP) and ultrafast bootstrap support values (UFB), respectively. Black circles represent nodes supported by BPP and UFB of 1.0 and 100. Samples in bold are new sequence from this study.

