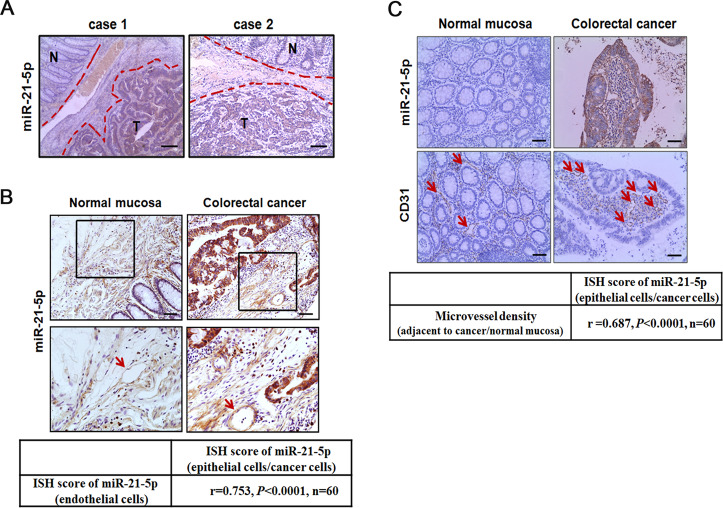
Fig. 1. Expression and localization of miR-21-5p in CRC.
A Expression of miR-21-5p in primary CRC tissues (T) and matched adjacent normal mucosa (N) by ISH (n = 60). Scale bars represent 100 µm. B Expression of miR-21-5p in vessels (indicated by arrows) adjacent to primary CRC tissues and matched adjacent normal mucosa by ISH. Correlation analysis of miR-21-5p expression in colorectal epithelial cells/cancer cells and their adjacent endothelial cells. MiR-21-5p levels were scored as described in “Methods”. Spearman’s correlation coefficient (r) and P-value are shown (n = 60). Scale bars in top panels represent 50 µm. C Correlation analysis of miR-21-5p expression in colorectal epithelial cells/cancer cells and their adjacent microvessel density (labeled by CD31 and indicated by arrows). Microvessel density was scored as described in Methods. Spearman’s correlation coefficient (r) and P-value are shown (n = 60). Scale bars represent 50 µm.

