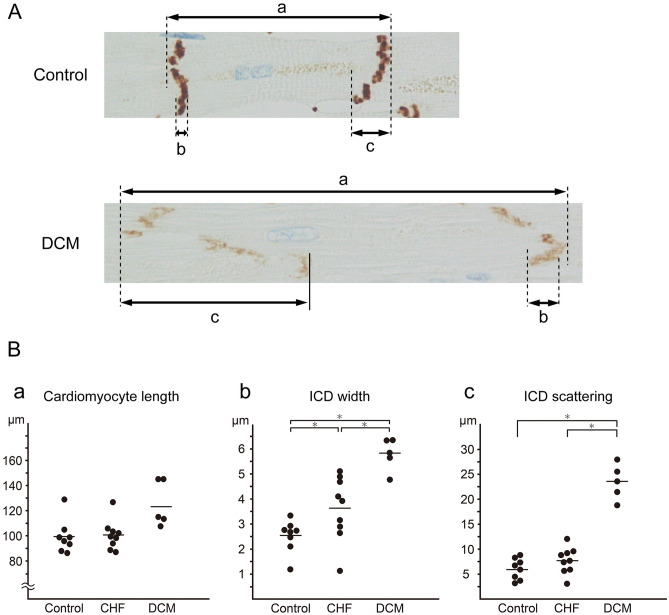
Figure 5.
Cardiomyocyte length, ICD width, and ICD scattering in each group. (A) Morphology of cardiomyocytes and ICDs in each group was observed in N-cadherin–stained specimens. Cardiomyocyte length (a), ICD width (b) and ICD scattering (c) were measured. (B) Cardiomyocyte length was significantly greater in the DCM group than in the control groups (a). ICD width was significantly greater in the DCM group than in the CHF and control groups (b), and differed significantly between the CHF group and the control group. The variation in the CHF cases was large. ICDs were more scattered in the DCM group than in the CHF and control groups (c). Statistical significance of differences between groups was determined using the Mann–Whitney U test: *P < 0.05.

