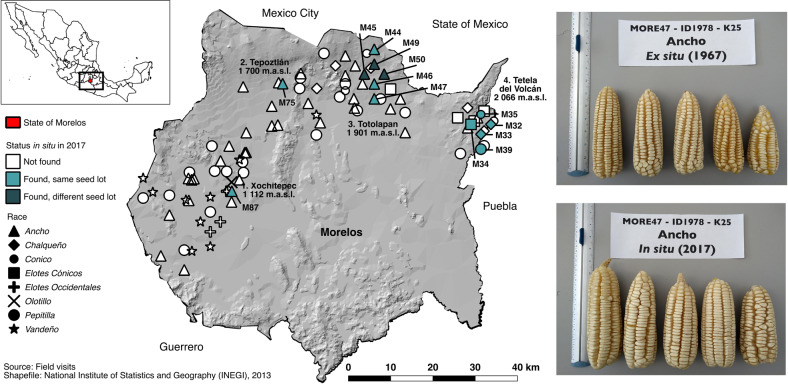
Fig. 1. Geographical distribution of the 93 ex situ samples collected in 1967 in Morelos state, Mexico (Kato 1967), with the 13 samples collected in situ for the genetic comparison with their ex situ counterparts in 2017.
Colors and shapes represent each sample’s status in 2017 and the races they represent, according to the legend. Text labels indicate the municipalities where in situ samples were collected in 2017 and samples’ IDs. Pictures illustrate representative ears for a pair of ex situ and in situ Ancho samples.

