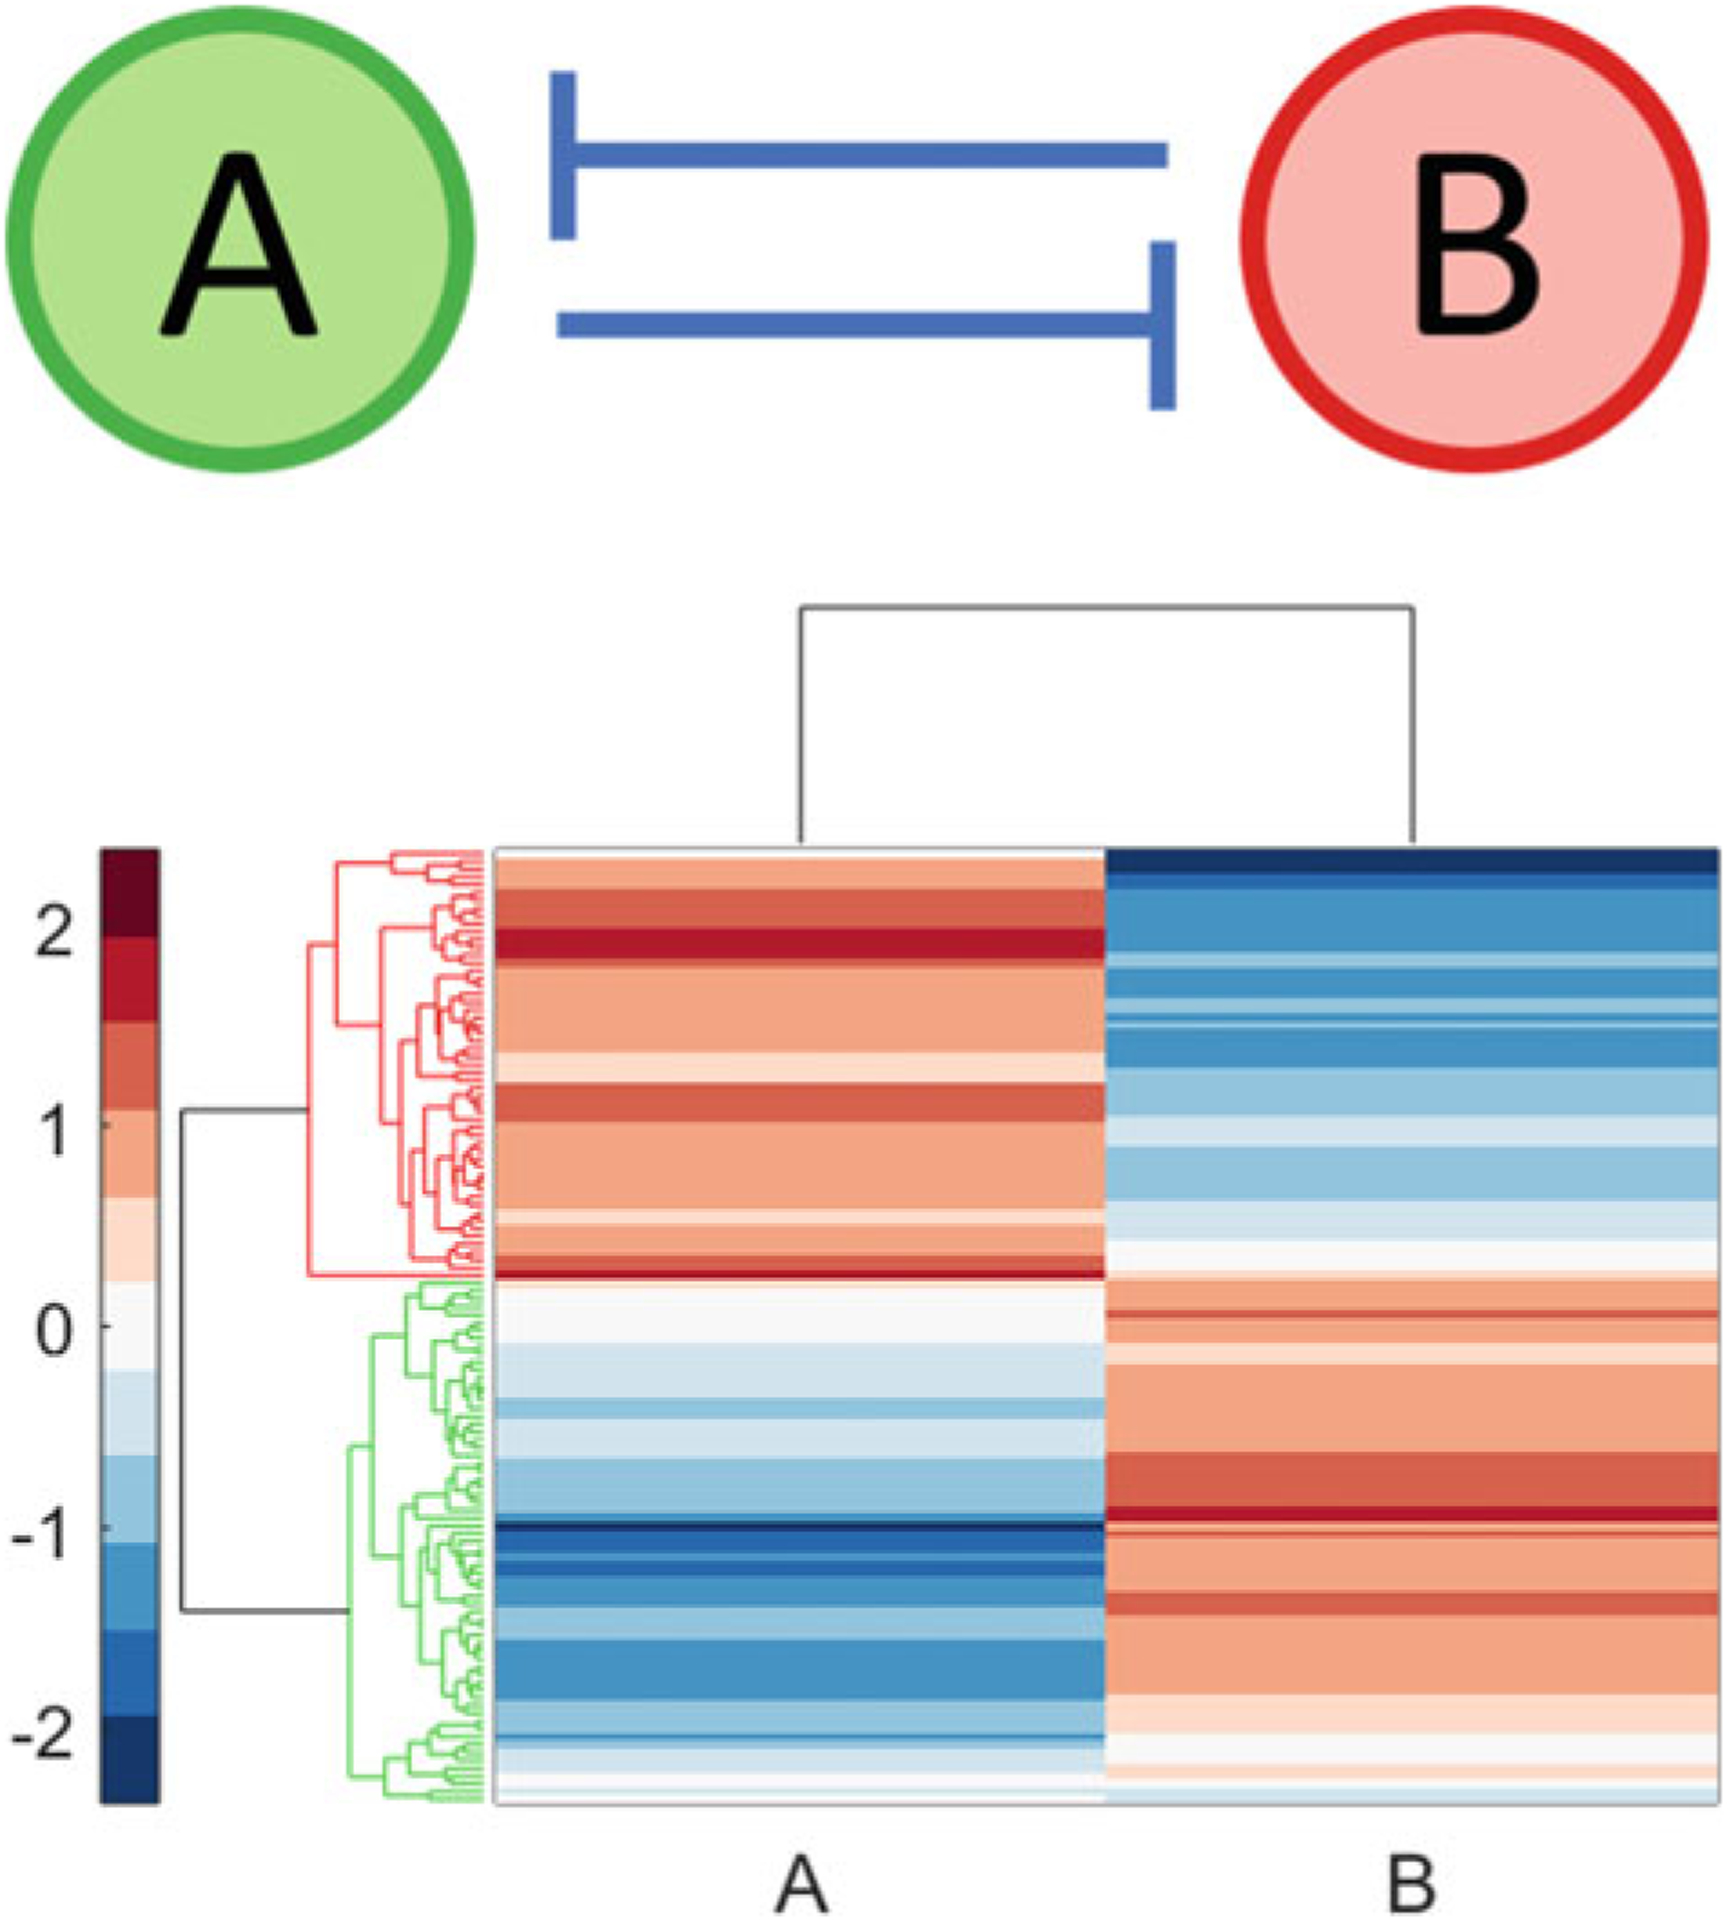
Fig. 2.

Transcription factors A and B with a mutual inhibitory feedback loop (top). RACIPE was used to generate 100 kinetic models corresponding to this topology. A total of 122 distinct steady states were obtained—78 kinetic models exhibited only one steady state while 22 kinetic models exhibited two steady states. Hierarchical clustering of this collection of steady states (bottom) revealed that these steady states can be divided into two phenotypic classes: high A, low B (highlighted in red) and low A, high B (highlighted in green). Thus, in a population wherein each cell carries a copy of this circuit, cells can exhibit two distinct phenotypic states. Hierarchical clustering was carried out using the Z-scores of the log2 transformed expression levels
