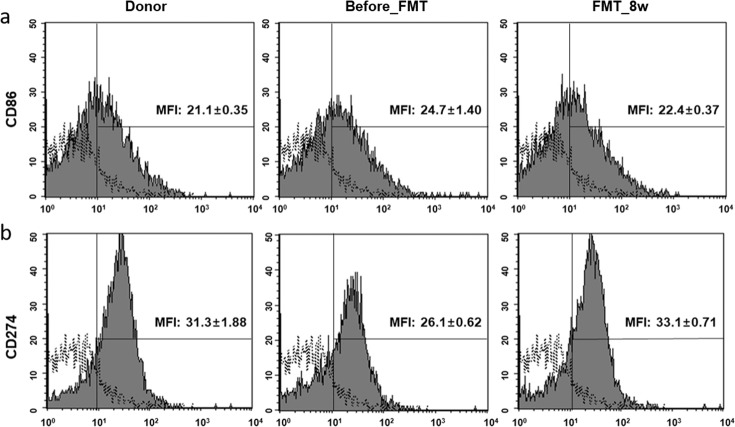
Fig. 5. Effect of FMT treatment on T-cell activation, as determined by FACS.
T-cell activation was confirmed via flow cytometric analysis. The solid histogram shows isotype antibodies. The filled histogram shows that a the MFI of CD 86 was decreased and b the MFI of CD 274 was increased in splenocytes in the FMT group compared to the before_FMT group. The unfilled histogram indicates the isotype antibody control. FMT fecal microbiota transplantation, FACS fluorescence-activated cell sorting, MFI mean florescence intensity.

