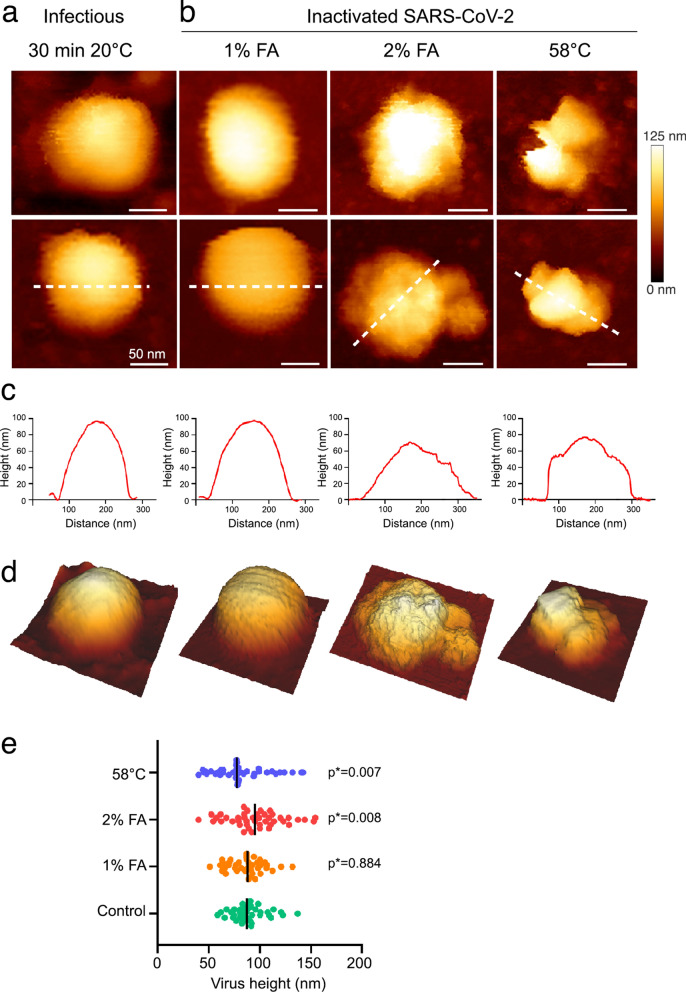
Figure 2.
SARS-CoV-2 inactivation monitored by topographic imaging using QI mode AFM in buffer. (a) Native infectious, control SARS-CoV-2 sample kept for 30 min at room temperature. (b) Virus particles inactivated with 1% and 2% FA for 30 min at 20 °C, or incubated at 58 °C for 30 min. Scale bars are 50 nm. The color gradient for Z scale is the same for all AFM panels. (c) Topographical profile plots measured along the dotted lines in the lower panel in (a). (d) 3D projection of the particles in the lower panel (a). (e) Distribution of the topographical maximal height of treated and untreated SARS-CoV-2 particles (control n = 39; 1% FA n = 40; 2% FA n = 43; 58 °C n = 39). P values are indicated and were computed by using two-sided independent t tests and comparing the results to those for the untreated sample.

