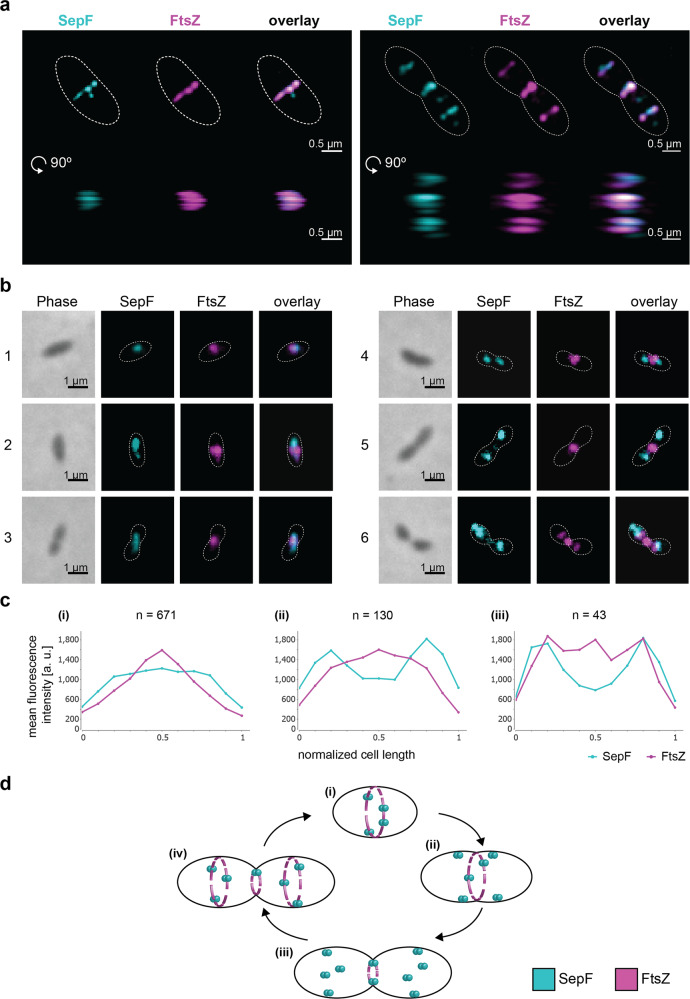
Fig. 1. SepF co-localizes with FtsZ during the M. smithii cell cycle.
M. smithii cells were permeabilized with PeiW and immunostained with anti-MsSepF and anti-MsFtsZ antibodies. a 3D Structured Illumination Microscopy (SIM) maximum projections of a non-constricting M. smithii cell (left panel) and a constricting cell (right panel) stained with anti-MsSepF (cyan) and anti-MsFtsZ antibodies (magenta). Front views of single channels and the overlay are depicted (above) as well as the side view shifted by 90° (below). White dotted lines represent the cell outlines and scale bars are 0.5 µm. b Phase contrast (Phase) and corresponding epifluorescence images of representative co-labeled M. smithii cells (SepF in cyan, FtsZ in magenta and an overlay of both). Cells are arranged from non-constricting to constricting from 1 to 6. White dotted lines represent the cell outlines deduced from the corresponding phase contrast images and the scale bars are 1 µm. c Mean fluorescence intensity plots of cells grouped into three classes according to the detected FtsZ fluorescent maxima (0–1, 2 or 3 maxima detected) with the corresponding SepF (cyan) and FtsZ (magenta) mean fluorescence intensity [a. u.] of each group plotted against the normalized cell length [0-1]. d Schematic view of SepF (cyan) and FtsZ (magenta) localization pattern during the life cycle of M. smithii. (i) In non-constricting cells, both proteins co-localize at the septation plane. (ii) and (iii) SepF progressively moves to the future division plane prior FtsZ. (iv) As constriction is almost completed, FtsZ and SepF co-localize at the prospective septation plane of the daughter cells. The data shown here are representative for experiments performed in triplicate.

