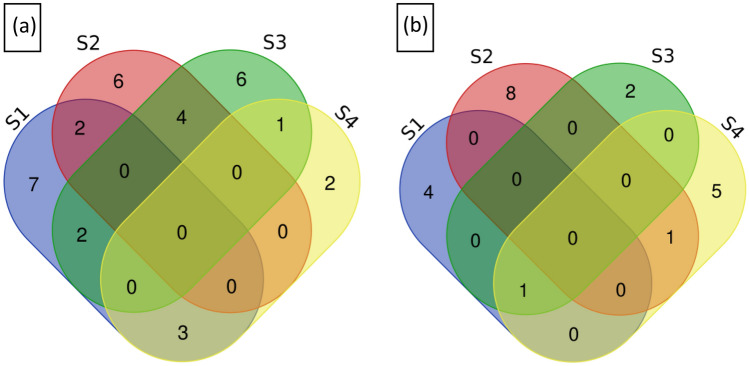
Fig. 4.
Venn diagram showing number of overlapping differentially expressed mature miRNAs (p value ˂ 0.05 and fold change ˃ 1 or ˂ − 1) between comparisons a known miRNAs. b Novel miRNAs. The comparisons are S1—Co 8021 control vs treated (V1_11 vs V1_31), S2—Co 06022 control vs treated (V2_11 vs V2_31), S3—Co 8021 control vs Co 06022 control (V1_11 vs V2_11), S4—Co 8021 treated vs Co 06022 treated (V1–31 vs V2–31). The numbers within the intersection are the number of differentially expressed miRNAs common between the different comparisons and the numbers outside the intersection are the differentially expressed miRNAs specific to each comparison

