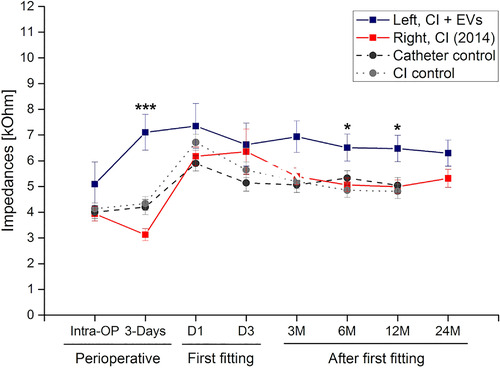
FIGURE 3.

Mean impedance values over time. Following bilateral cochlea implantation (CI) at the right side first and the contralateral side 4 years later, mean impedance values are depicted over time. Blue line depicts the vesicle treated side and red the patient's contralateral side. Historical data from controls (dotted line) and steroid‐treated patients via the inner ear catheter (intermitted line) are included for comparison. Impedance values were recorded for each of the twelve electrode contacts per side and condition and are depicted as mean values and standard deviation over a time course of more than 24 months. The first fitting (FF) is done 4 weeks after cochlear implantation. Data from day 1 and day 3 during FF are shown as well as data from the follow‐up visits (3 M, 6 M, 12 M and 24 M). Levels of significance are indicated as * P < 0.05 and ***P < 0.001
