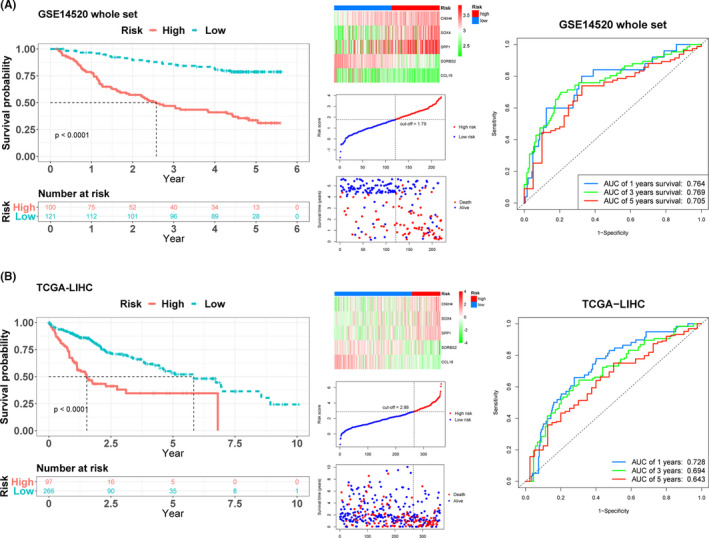
FIGURE 3.

Kaplan–Meier survival analysis, risk score analysis and time‐dependent ROC analysis in whole and The Cancer Genome Atlas Liver Hepatocellular Carcinoma (TCGA‐LIHC) sets for the five‐gene signature in HCC. The Kaplan–Meier plot, five mRNAs heatmap, cut‐off value, survival states of patients, and time‐dependent ROC analysis in (A) whole and (B) TCGA‐LIHC sets
