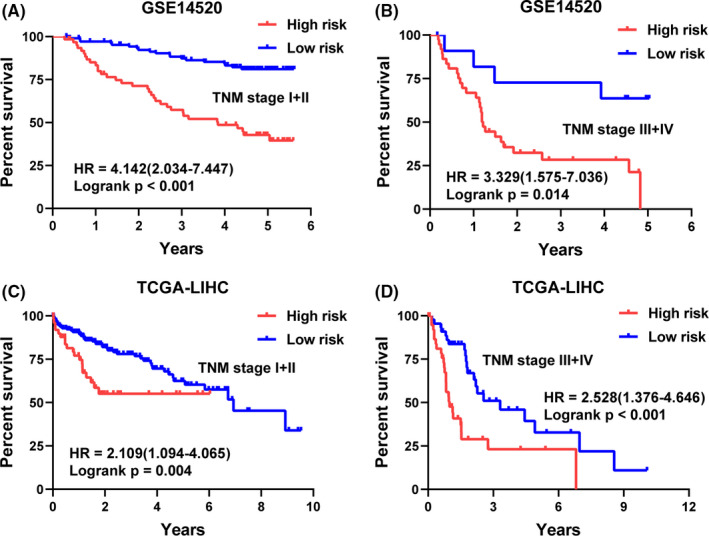
FIGURE 5.

Kaplan–Meier plots of the five‐gene signature in different TNM stage of HCC patients. Patients in the high‐risk group showed poorer overall survival compared with those in the low‐risk group in (A, C) TNM stage I+II and (B, D) TNM stage III + IV in GSE14520, and TCGA‐LIHC sets
