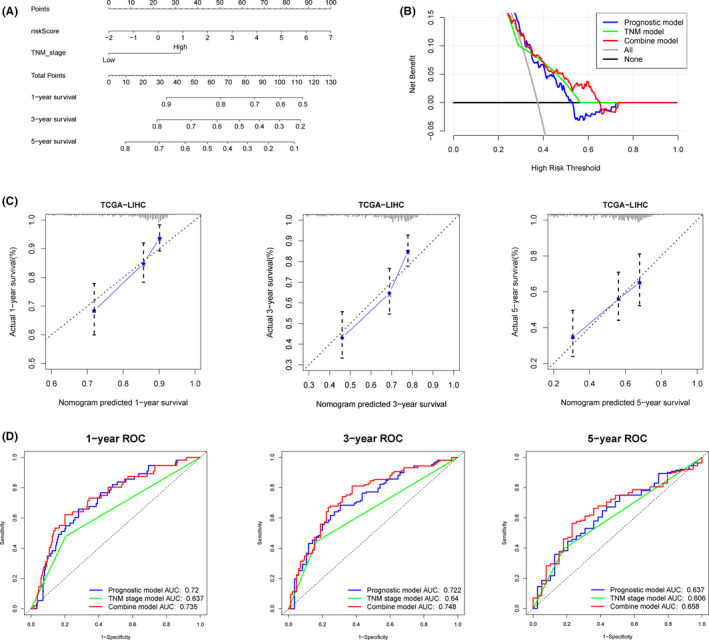
FIGURE 7.

A predictive nomogram building and validating in TCGA‐LIHC set. A, The nomogram was built based on two independent prognostic factors. B, The decision curve analysis (DCA) of prognostic, TNM stage, and combined models for 5‐year overall survival. C, The calibration plots for internal validation of the nomogram for 1‐year, 3‐year, and 5‐year survival, respectively. D, The time‐dependent ROC curves of the nomograms compared for 1‐year, 3‐year, and 5‐year overall survival, respectively
