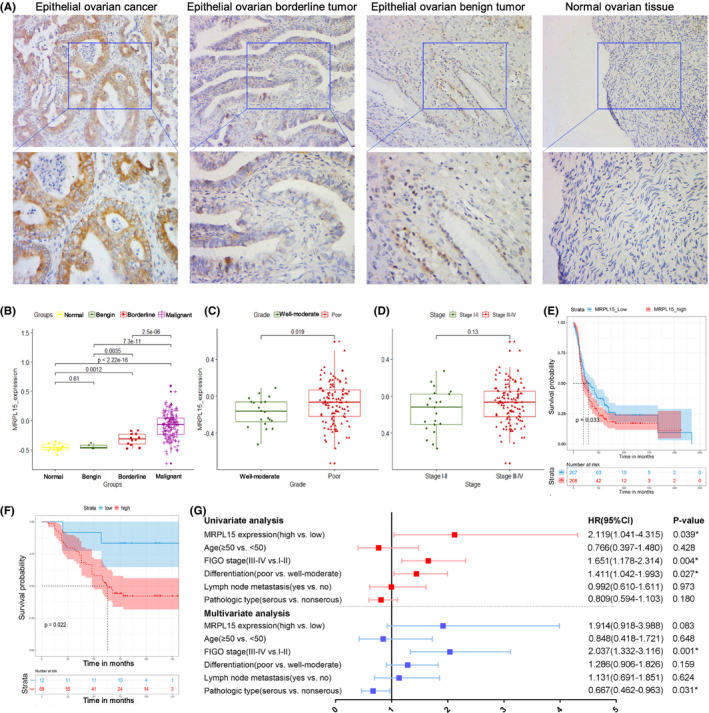
FIGURE 7.

Expression of MRPL15 in epithelial ovarian tissues and its correlation with the prognosis of patients with ovarian cancer. (A) Typical immunohistochemical staining images of MRPL15 in epithelial ovarian cancer, epithelial borderline ovarian tumors, epithelial benign ovarian tumors, and normal ovarian tissues (upper: SP*200, lower: SP*400). (B–D) Expression of MRPL15 in different groups of patients and its relationship with differentiation and FIGO stages in the GSE51088 dataset. (E) Kaplan–Meier analysis of the correlation between MRPL15 expression and OS in the GSE13876 dataset. (F) Kaplan–Meier analysis of the correlation between MRPL15 expression and OS in the 81 patients with ovarian cancer. (G) Forest map of Cox regression analysis of OS in the 81 patients with ovarian cancer. * p < 0.05. CI, confidence interval; FIGO, International Federation of Gynecology and Obstetrics; HR, hazard ratio; OS, overall survival
