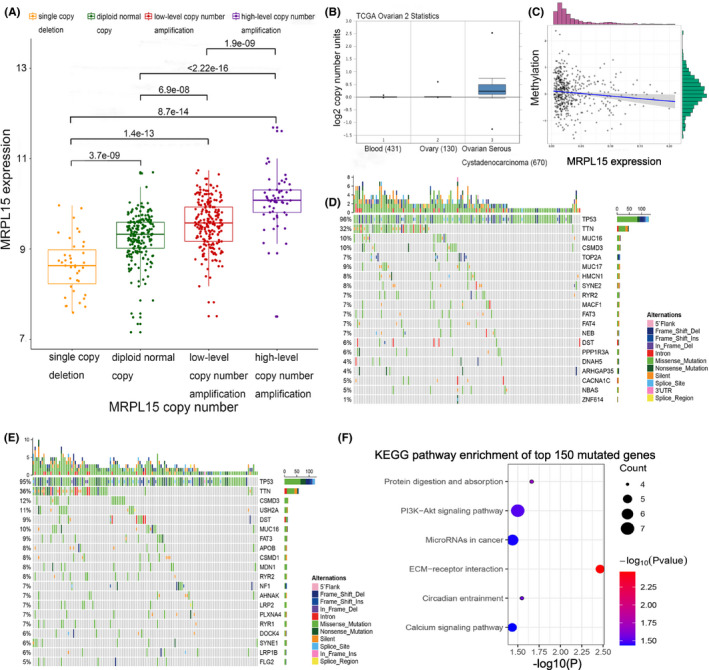
FIGURE 8.

Molecular mechanisms of increased expression of MRPL15 in malignant ovarian tissues. (A) Correlation between the copy number and expression of MRPL15. (B) Difference in MRPL15 copy number between normal tissues and cancer cells in TCGA Ovarian2 Statistics (Oncomine). (C) Correlation between methylation and the expression of MRPL15. (D) Top 20 mutated genes in the low‐MRPL15‐expression group. Different types of somatic mutations are marked by different colors. (E) Top 20 mutated genes in the high‐MRPL15‐expression group. (F) KEGG pathway enrichment results of the top 150 mutated genes correlated with the overexpression of MRPL15. Bubble size: number of genes involved in a pathway; Bubble color; p‐value
