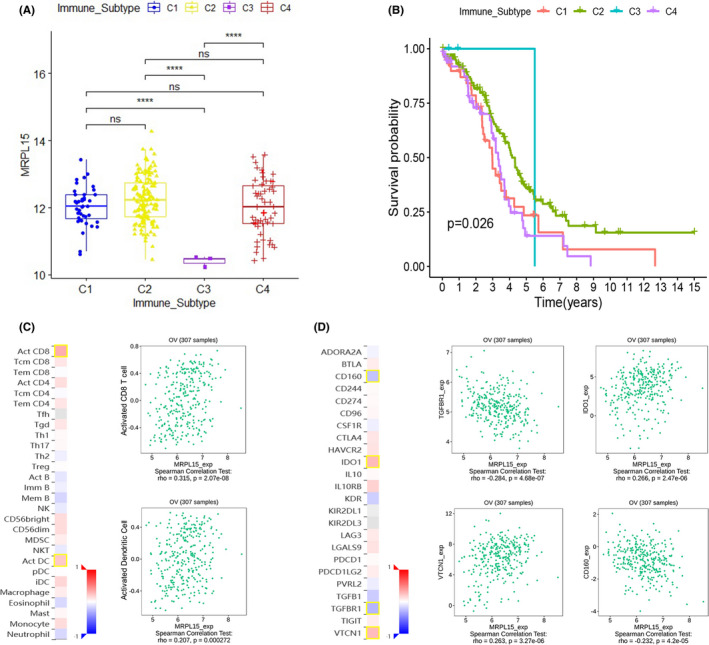
FIGURE 9.

Immune analysis of MRPL15 in ovarian cancer. (A) Relationship between MRPL15 expression and immune subtype in TCGA ovarian cancer database. (B) Prognostic differences between the four immune subtypes in TCGA ovarian cancer database. (C) Correlation between MRPL15 expression and TILs (TISIDB). (D) Correlation between MRPL15 expression and immune inhibitors (TISIDB). In the heatmaps of C and D, the red and blue squares represent positive and negative correlations, respectively, and the color intensity represents the size of the Spearman correlation coefficient. The scatter plots show TILs or immune inhibitors with the strongest correlation with MRPL15 expression. TILs, tumor‐infiltrating lymphocytes
